
The development spread is a back-of-the-envelope calculation real estate developers use to evaluate whether a project is worth pursuing. It compares the income yield a developer expects to achieve on the cost of a new project with the cap rate investors are paying for similar, already stabilized properties.
The idea is simple. If you can develop a property for less than investors would pay for the completed building, you can create value. The development spread is a quick way to measure that opportunity before building a detailed financial model.
For example, suppose you can develop a building for $2,500,000 that will generate $250,000 in annual net operating income (NOI) once fully leased. Your yield on cost would be 10%. If similar stabilized properties trade at an 8% cap rate, your development spread would be 2%, or 200 basis points.
But what does that 200-basis-point spread tell us? How much value might the project create? And is that enough to justify the risks of development? Let’s work through the calculation, then use it to estimate profit, set a maximum land price, and test what happens when our assumptions change.
What Is the Development Spread?
The development spread is the difference between a property’s projected stabilized yield on cost and the market cap rate for comparable stabilized properties.
Development Spread = Yield on Cost − Market Cap Rate
In development, the yield on cost is sometimes called the going-in cap rate or build-to rate. The market cap rate is sometimes called the going-out cap rate or sell-to rate. Be aware that “going-in” and “going-out” can mean something different when discussing the purchase and sale of an existing property.
Yield on Cost
The yield on cost is the projected stabilized NOI divided by the total cost of developing the property.
Yield on Cost = Stabilized NOI / Total Development Cost

Stabilized NOI is the annual net operating income the property is expected to produce after construction and lease-up, once it reaches a normal level of occupancy. Total development cost includes the land, construction, professional fees, leasing costs, financing costs, and other expenses required to complete and stabilize the project.
If a project costs $2,500,000 and is expected to generate $250,000 in stabilized NOI, its yield on cost is $250,000 / $2,500,000, or 10%.
Yield on cost measures property income relative to development cost. It is not the same as the developer’s internal rate of return or return on equity.
Market Cap Rate
The market cap rate measures the relationship between the NOI of an income-producing property and the price investors will pay for it.
Market Cap Rate = Net Operating Income / Market Value

If a stabilized property generates $250,000 in NOI and sells for $3,125,000, its market cap rate is $250,000 / $3,125,000, or 8%.
To estimate the cap rate for a proposed development, we can study recent sales of comparable properties and speak with brokers, investors, lenders, and appraisers active in the local market. Since the project may not stabilize for several years, the rate should reflect what we reasonably expect at stabilization, not simply today’s market.
Calculating the Development Spread
With a 10% yield on cost and an 8% market cap rate, the calculation is straightforward:
Development Spread = 10% − 8% = 2%, or 200 basis points
One basis point equals 0.01 percentage points, so a spread of 2 percentage points equals 200 basis points.
You may hear a developer describe this as “building to a 10 cap and selling to an 8 cap.” The developer expects to create an income stream for $2,500,000 that investors would value at $3,125,000. The spread measures the gap between those two yields, not a 2% annual investment return.
Practical Development Spread Example
Let’s look at how we would use the development spread to screen a potential office building development. All amounts in this example are hypothetical.
Step 1: Estimate Total Development Cost
Our preliminary development budget is:
| Development Budget | Estimated Cost |
|---|---|
| Land and acquisition | $400,000 |
| Hard construction costs | $1,550,000 |
| Soft costs | $225,000 |
| Tenant improvements and leasing commissions | $125,000 |
| Contingency | $100,000 |
| Construction financing and carrying costs | $100,000 |
| Total Development Cost | $2,500,000 |
The land and construction estimates are only part of the budget. We also need to include the expenses required to deliver a leased, stabilized building. Depending on the project, these can include architectural and engineering fees, permits, construction interest, property taxes, insurance, tenant improvements, and leasing commissions.
Leaving a material cost out of the budget makes the yield on cost and development spread look better than they really are. It is also important not to double-count expenses already included elsewhere in the budget.
Step 2: Estimate Stabilized NOI
Next, we estimate the property’s annual income and expenses once construction is complete and the building reaches a normal level of occupancy. Our simplified operating proforma looks like this:
| Stabilized Operating Proforma | Annual Amount |
|---|---|
| Potential gross income | $360,000 |
| Less: Vacancy and credit loss | ($18,000) |
| Effective gross income | $342,000 |
| Less: Operating expenses | ($92,000) |
| Stabilized NOI | $250,000 |
We are using stabilized NOI rather than the income the building might generate during construction or initial lease-up. The building could have little or no income for quite some time before reaching this level.
The operating assumptions also need to match how the comparable sales were analyzed. For example, inconsistent treatment of property taxes, management fees, vacancy, or replacement reserves can make the market cap rate comparison misleading.
Step 3: Estimate the Market Cap Rate
Based on recent sales of similar stabilized office properties and discussions with local market participants, we estimate an 8% market cap rate for our completed building.
That is an underwriting assumption, not a guaranteed sale price. If the building takes two years to complete and lease up, the cap rate at stabilization could be different. We will test that risk later.
Step 4: Calculate the Spread
Our yield on cost is $250,000 / $2,500,000 = 10%.
Subtract our estimated 8% market cap rate, and the development spread is 200 basis points.
That is a promising starting point. But a 200-basis-point spread is easier to understand when we convert it into an estimate of the value created.
Development Spread and Profit
One of the most useful things about the development spread is that it lets us estimate the value created by a project. We already know the projected stabilized NOI, the market cap rate, and the total development cost.
First, estimate the completed property’s value using the direct capitalization method:
Stabilized Market Value = Stabilized NOI / Market Cap Rate
Stabilized Market Value = $250,000 / 0.08 = $3,125,000
Now subtract what we expect to spend developing the property:
Gross Development Profit = Stabilized Market Value − Total Development Cost
Gross Development Profit = $3,125,000 − $2,500,000 = $625,000
Based on our assumptions, the building would be worth $625,000 more than it costs to develop. This is an estimate of gross value creation, not necessarily the cash profit the developer will take home. It does not deduct selling expenses, income taxes, or costs omitted from the development budget.
Profit on Cost vs. Profit Margin
We can express that $625,000 of estimated profit in two ways. The difference comes down to what we use in the denominator.
Profit on Cost = Gross Development Profit / Total Development Cost
Profit on Cost = $625,000 / $2,500,000 = 25%
This measures profit relative to the amount spent on the project. It is also called a markup on cost.
Profit Margin on Value = Gross Development Profit / Stabilized Market Value
Profit Margin on Value = $625,000 / $3,125,000 = 20%
Here, the profit is measured against the completed property’s estimated value. Both percentages are correct, but they answer different questions. The project has a 25% profit on cost and a 20% profit margin on value.
Calculating Profit Directly From the Two Yields
There is also a shortcut. Since yield on cost and the market cap rate both use the same stabilized NOI, we can calculate profit on cost without first calculating the property’s dollar value:
Profit on Cost = (Yield on Cost / Market Cap Rate) − 1
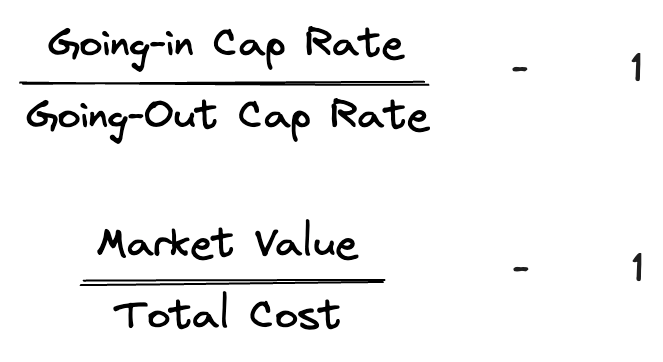
Profit on Cost = (10% / 8%) − 1 = 25%
And we can calculate the margin on value this way:
Profit Margin on Value = 1 − (Market Cap Rate / Yield on Cost)
Profit Margin on Value = 1 − (8% / 10%) = 20%
If yield on cost equals the market cap rate, the estimated stabilized value equals total development cost. If yield on cost falls below the market cap rate, the implied stabilized value is below cost. That is why the development spread works as an initial test of whether a project is creating value.
What Is a Good Development Spread?
A commonly cited rule of thumb is to target a development spread of 150 to 250 basis points. That can be a useful starting point, but there is no single spread that makes every development attractive.
Consider two projects. One is a preleased industrial building with approved plans and a fixed-price construction contract. The other is a speculative office building that still needs zoning approval and tenants. A 200-basis-point spread does not offer the same margin of safety in both situations.
The time required to complete and stabilize the project matters, too. A development that can be stabilized in 18 months presents a different investment opportunity from one that could take four years, even if both show the same spread.
The starting cap rate matters as well. A 200-basis-point spread between a 7% yield on cost and a 5% market cap rate implies a 40% profit on cost. The same 200-basis-point spread between a 10% yield on cost and an 8% market cap rate implies only a 25% profit on cost.
So rather than treating 200 basis points as a pass-or-fail test, developers should consider the project’s risks, time to stabilization, projected profit, and required investment return.
Using the Development Spread to Determine Maximum Project Cost
The spread is also useful when working backward from a required return. Instead of asking what spread we will achieve at a given cost, we can ask how much we can afford to spend while still meeting our target spread.
Maximum Development Cost = Stabilized NOI / (Market Cap Rate + Required Development Spread)
Suppose we expect $250,000 in stabilized NOI, estimate an 8% market cap rate, and require a 200-basis-point spread. Our target yield on cost is therefore 10%.
Maximum Development Cost = $250,000 / 0.10 = $2,500,000
This means we can spend up to $2,500,000 on the entire project before falling below our required spread, assuming all our other inputs remain unchanged.
Calculating the Maximum Land Price
Now suppose our estimated development costs excluding land are $2,100,000. We can estimate how much we can afford to pay for the site:
Maximum Land Price = Maximum Development Cost − All Other Development Costs
Maximum Land Price = $2,500,000 − $2,100,000 = $400,000
If the seller instead wants $600,000 for the land, our total project cost increases to $2,700,000, assuming the other budget items stay the same.
Revised Yield on Cost = $250,000 / $2,700,000 = 9.26%
Revised Development Spread = 9.26% − 8% = 1.26%, or about 126 basis points
The project would still appear to create value, but it would no longer meet our required 200-basis-point spread. That gives us a practical starting point for a land offer or a discussion about reducing costs or increasing projected income.
This is an initial calculation. In an actual deal, a higher land price may also change financing fees, interest carry, taxes, and other costs. The full development budget should be updated before the go or no go call is made.
Calculating the Required Stabilized NOI
We can rearrange the same formula to determine how much income a project must generate to support a particular development budget:
Required Stabilized NOI = Total Development Cost × (Market Cap Rate + Required Development Spread)
Required Stabilized NOI = $2,500,000 × (8% + 2%) = $250,000
These reverse calculations make the development spread useful when evaluating land prices, preliminary construction budgets, and rental assumptions before spending the time to build a detailed proforma.
How Changes in NOI, Costs, and Cap Rates Affect the Spread
A development spread is only as reliable as its assumptions. Construction costs can rise, tenants can pay less rent than expected, and market cap rates can increase before the building is stabilized.
Let’s stress-test our office building. In the base case, total development cost is $2,500,000, stabilized NOI is $250,000, and the market cap rate is 8%. That gives us a 200-basis-point development spread and $625,000 of estimated gross value creation.
| Scenario | Development Spread | Gross Value Above/(Below) Cost |
|---|---|---|
| Base case | 200 bps | $625,000 |
| Stabilized NOI decreases 10% | 100 bps | $312,500 |
| Development costs increase 10% | 109 bps | $375,000 |
| Market cap rate rises to 8.5% | 150 bps | $441,176 |
| All three occur | -32 bps | ($102,941) |
For each scenario, we recalculate stabilized value using the revised NOI and cap rate, then subtract the revised total development cost.
In the last scenario, development cost rises to $2,750,000, stabilized NOI falls to $225,000, and the market cap rate increases to 8.5%.
Revised Yield on Cost = $225,000 / $2,750,000 = 8.18%
Revised Development Spread = 8.18% − 8.5% = -0.32%, or about -32 basis points
Stabilized Market Value = $225,000 / 0.085 = $2,647,059
Gross Value Above/(Below) Cost = $2,647,059 − $2,750,000 = ($102,941)
The original 200-basis-point spread is gone. None of those changes is especially dramatic on its own, but together they turn $625,000 of expected gross value creation into a projected loss in value.
It is also useful to calculate the project’s break-even points. Holding all other inputs constant, the base-case spread reaches zero if total cost rises 25%, stabilized NOI falls 20%, or the market cap rate increases from 8% to 10%. Those are just mathematical break-even points, and smaller changes to several assumptions can have the same effect.
Limitations of the Development Spread
The development spread is a useful first screen, but it leaves out several things that matter to the actual investment.
It Does Not Account for Timing
Consider two developments with the same total cost, stabilized NOI, and estimated market cap rate. One takes 18 months to complete and stabilize; the other takes four years. Both have the same development spread, assuming equal total costs, but the second ties up capital much longer.
The development spread does not measure the cost of waiting for cash flows. An internal rate of return calculation does.
Stabilized NOI Is a Forecast
A development project may not have a building, tenants, or actual operating history when the original underwriting is prepared. Its stabilized NOI is an estimate based on projected rental rates, occupancy, reimbursements, and expenses.
If the building takes longer to lease than expected, investors may have to fund operating shortfalls and carrying costs. The original stabilized NOI could eventually be achieved, but the delay can still hurt the investment return.
The Future Cap Rate Is Uncertain
The cap rate at stabilization may differ from the cap rates observed when the project is first underwritten. Changes in interest rates, investor demand, market rents, and available capital can all affect what buyers will pay.
This is why it is worth testing more than one cap rate rather than assuming the current market will still exist when the building is ready to sell.
It Does Not Measure Return on Equity
The development spread is based on property income and total development cost. It does not directly measure when equity is contributed, when distributions are received, the effects of loan repayment, or the return investors earn on their actual equity contributions.
A project can show an attractive spread and still fail to meet a developer’s required equity IRR. Those are different calculations and should be evaluated separately.
A Positive Spread Does Not Guarantee a Good Investment
A project might create some value on paper without creating enough to compensate the developer for several years of work, uncertainty, and the risk of losing capital. A small positive spread is not an automatic green light.
A negative spread is a warning that the estimated stabilized value is below total cost. But the spread alone does not establish the full investment return, particularly when a project has unusual cash flow timing or a longer-term hold strategy.
Development Spread vs. Discounted Cash Flow Analysis
The development spread is a good place to start. It gives a developer a quick way to see whether the relationship between income, cost, and market value is promising enough to justify further work.
If the project passes that initial screen, the next step is to refine the development budget and build a detailed real estate proforma. A monthly proforma is especially helpful for modeling construction draws, financing costs, lease-up, concessions, tenant improvements, and the time required to reach stabilization.
A discounted cash flow analysis can then be used to estimate unlevered and levered IRR, net present value, equity multiple, and other investment measures.
That analysis can answer questions the development spread cannot: How long will investors wait to get their money back? How does debt affect the return on equity? What happens if lease-up is delayed by a year? Will the project still meet its required return if costs rise or the sale cap rate moves higher?
Our PropertyMetrics Proforma software is designed to help analyze complex commercial real estate cash flows, including development costs, construction financing, lease-up assumptions, and investment returns.
The two methods serve different purposes. The development spread helps identify an opportunity. A detailed proforma and discounted cash flow analysis help determine whether it is worth taking.
Conclusion
The development spread compares the projected stabilized yield on cost with the market cap rate for similar completed properties. It is one of the quickest ways to estimate whether a development project is likely to create value.
In our example, a $2,500,000 project generating $250,000 in stabilized NOI produced a 10% yield on cost. At an 8% market cap rate, the development spread was 200 basis points. That implied $625,000 in gross value creation, a 25% profit on cost, and a 20% profit margin on value.
We also used the spread to calculate a maximum total development cost and land price, then showed how changes in cost, NOI, and cap rates could eliminate the projected profit.
The important point is that the spread measures the gap between the cost of creating an income stream and what the market would pay for that income. It does not measure the actual return to investors. Use it to screen opportunities, then use a detailed development proforma to decide whether a project is worth pursuing.