The Net Present Value (NPV) is one of the most important and widely used concepts in finance and commercial real estate. In this article, you’ll learn:
- What is NPV
- NPV Formula
- NPV Meaning
- NPV Decision Rule
- NPV Discount Rate
- How to Calculate NPV
- How to Calculate NPV in Excel
What Is Net Present Value (NPV)?
Net Present Value (NPV) is an investment performance measure widely used in finance and commercial real estate. NPV is the difference between the present value of all cash inflows and the present value of all cash outflows. NPV tells an investor whether the investment is achieving a target yield at a given initial investment. Net present value also quantifies the adjustment to the initial investment needed to achieve the target yield, assuming everything else remains the same.
NPV Formula
The net present value formula is the sum of cash flows (CF) for each period (n) in the holding period (N), discounted at the investor’s required rate of return (r):
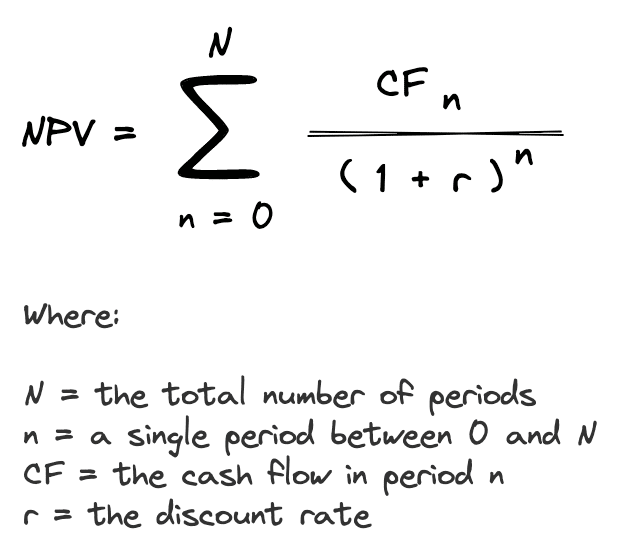
The NPV formula calculates the present value of all cash inflows and the present value of all cash outflows. Since the cash inflows are positive and the cash outflows are negative, these inflows and outflows offset each other and the resulting difference is the NPV. Let’s take a closer look at what the NPV means.
NPV Meaning
What’s the intuition behind the NPV formula? The net present value is simply the difference between the present value of all cash flows inflows and the present value of all cash outflows. In other words, NPV is simply value minus cost.

When NPV is viewed as value minus cost, then it’s easy to see that the NPV tells you whether what you are buying is worth more or less than what you’re paying.
There are only 3 possible categories NPV will fall into:
- Positive NPV. If NPV is positive, then it means the asset is worth more than what you are paying.
- Negative NPV. If NPV is negative, then it means the asset is worth less than what you are paying.
- Zero NPV. If NPV is zero, then it means you’re paying exactly what the asset is worth.
NPV Decision Rule
Since NPV can only be positive, negative, or zero, the NPV decision rule is pretty straightforward.
An independent standalone project should be accepted if the NPV is positive, rejected if the NPV is negative, and can be either accepted or rejected if the NPV is zero.
When considering several independent projects, all projects with a positive NPV should be accepted.
If capital is limited, then it may not be possible to accept every project with a positive NPV. When capital is rationed, the goal is to select the package of projects that gives the highest net present value. For example, consider the following investment opportunities (in millions of dollars):
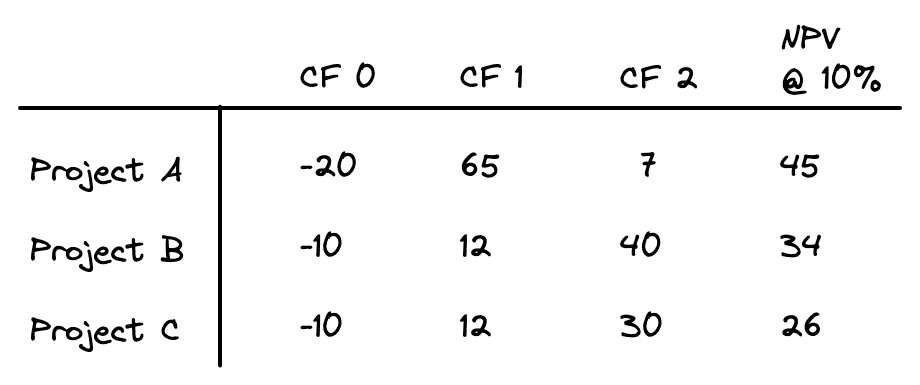
All three projects have a positive NPV and therefore would be accepted. However, if the firm only has $20 million to invest, then it cannot invest in all three. That means it could either invest in project A or in both projects B and C together. Although projects B and C individually have lower NPVs than project A, when taken together the package of projects B and C have a higher NPV than A.
In cases like this, choosing projects using only NPV can be problematic. Instead, projects should be ranked by the highest net present value per dollar of investment. To find the projects that have the biggest bang for the buck, you can rank projects using the profitability index. The profitability index is the NPV divided by the investment required:
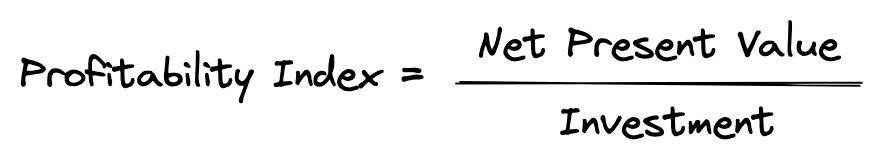
Once you calculate the profitability index for each investment, you can then rank them:
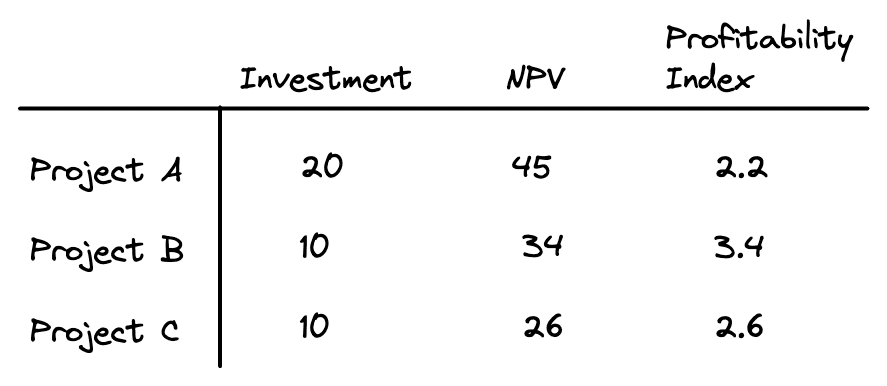
As shown above, the investment project with the highest profitability index is project B, followed by project C, and then A.
What is the Discount Rate in NPV?
One of the most important components of the net present value is the discount rate. The discount rate is the interest rate used to calculate the present value of future cash flows.
So, what discount rate should you use when calculating the net present value? Individual investors often use their opportunity cost of capital as their discount rate, while corporate investors use the Weighted Average Cost of Capital (WACC).
An individual’s opportunity cost of capital is the rate of return that can be earned in the marketplace on an investment that has a similar size and risk profile. For example, if you were considering an investment opportunity and decided not to invest, what would you invest that money into instead?
For corporate investors, the weighted average cost of capital is the firm’s average cost of capital from all sources including short-term debt, long-term debt, preferred equity, common stock, etc.
One easy way to think about the discount rate is that it’s simply the required rate of return that you want to achieve. The discount rate is what you would like to earn, the IRR is what you actually earn, and the NPV quantifies the difference.
How to calculate NPV
Let’s take a look at a few NPV examples to see exactly how to calculate and interpret the net present value. First we’ll look at the big picture, and then we’ll discuss how to actually calculate NPV. Here’s a sample set of cash flows:
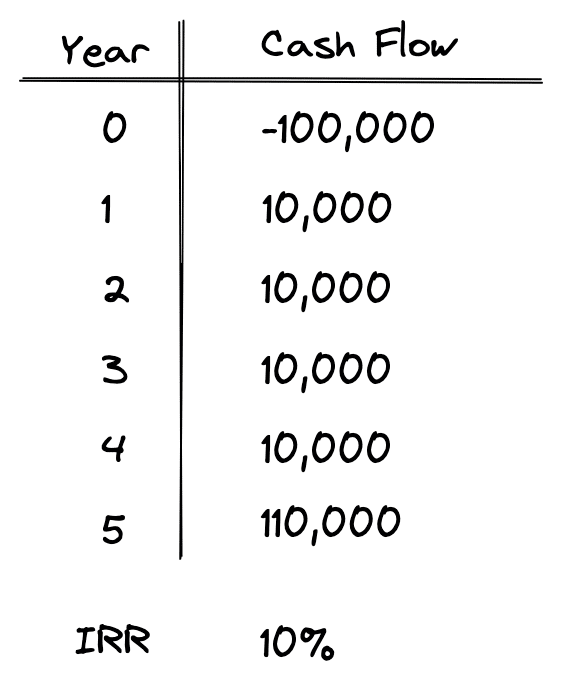
The above set of cash flows shows an upfront investment of -$100,000. It is a negative number because it’s money leaving our pocket. This investment returns $10,000 at the end of each year for 5 years, and then at the end of year 5 the original $100,000 investment is also returned.
As shown, when an internal rate of return or IRR is calculated on this set of cash flows, we get 10%. That means that the percentage rate earned on each dollar invested for each period it is invested is exactly 10%. So, what about the NPV, the other commonly used discounted cash flow measure?
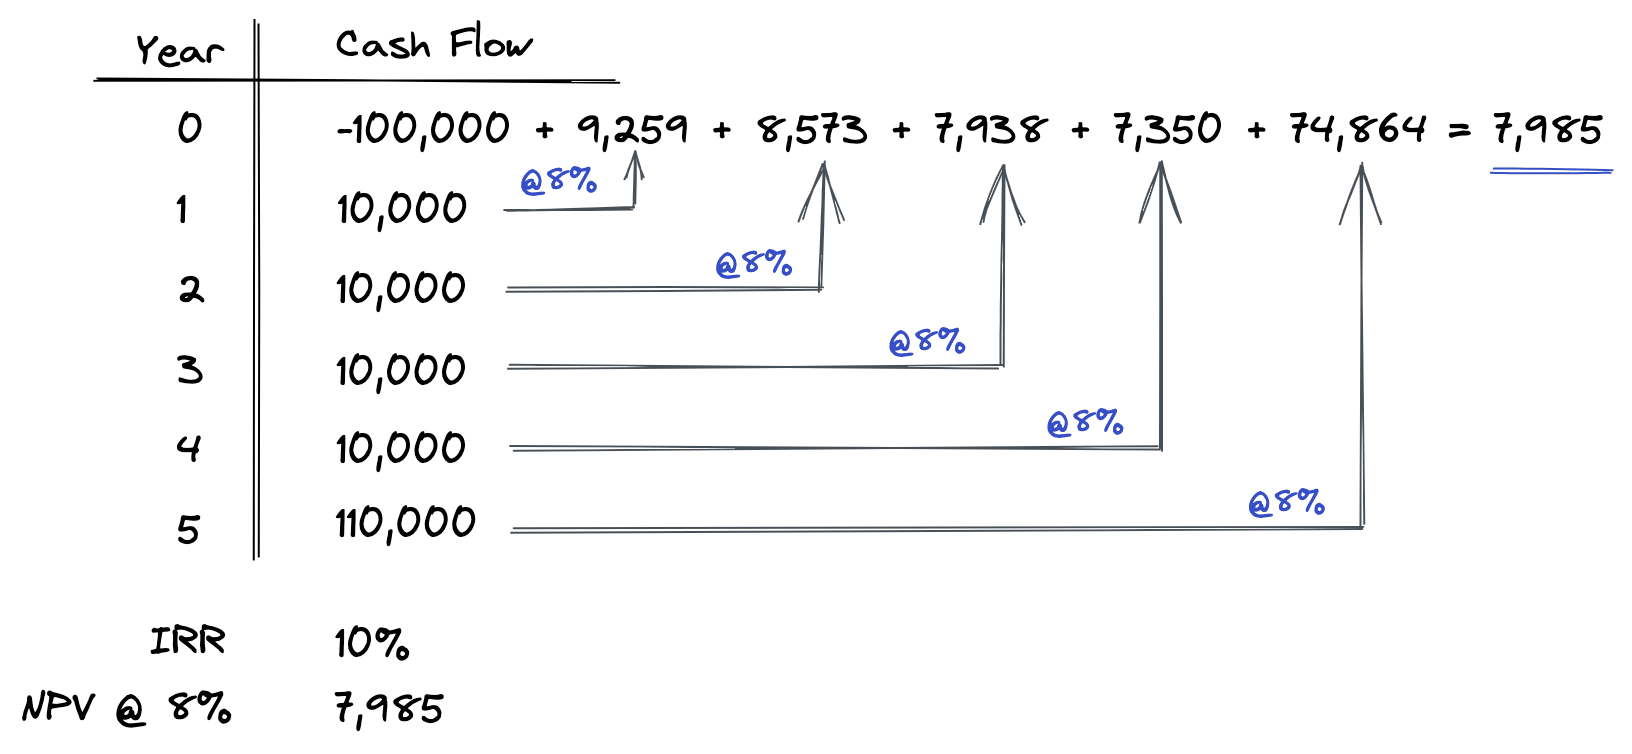
As shown in the diagram above, when we calculate an NPV on this set of cash flows at an 8% discount rate, we end up with a positive NPV of $7,985. As demonstrated above, NPV is calculated by discounting each of the cash flows back to the present time at the 8% discount rate. Then, each of these present values are added up and netted against the initial investment of $100,000 to find the net present value. This is precisely how NPV is calculated, step by step.
Let’s take another example of calculating NPV using the same set of cash flows, except with a different discount rate.
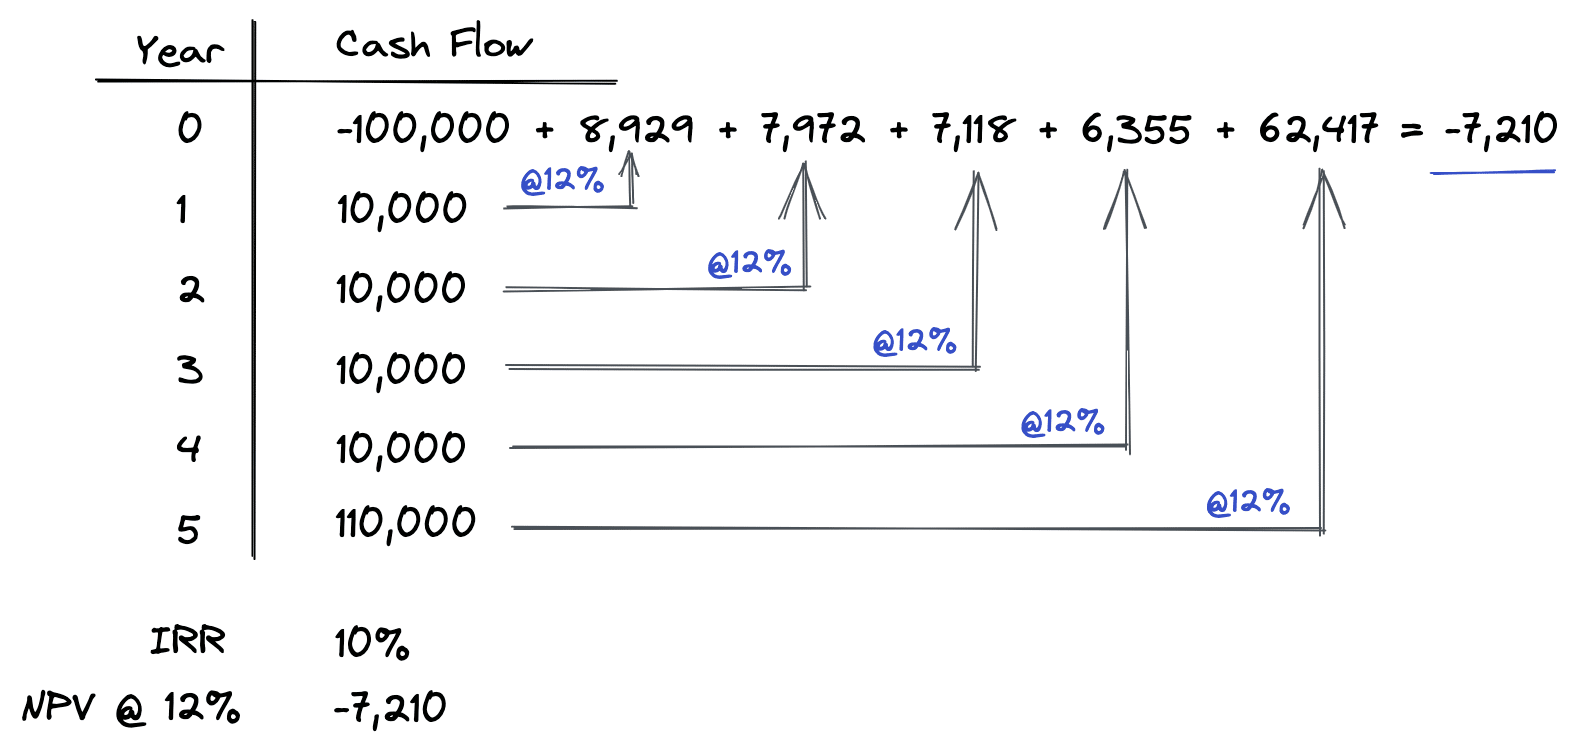
In this second example, the same process is followed to calculate the net present value. However, this time we are using a 12% discount rate instead of an 8% discount rate. As shown above, each future cash flow is discounted back to the present time at a 12% discount rate. Then each of these present values are added up and netted against the original investment amount of $100,000, resulting in an NPV of -$7,210.
Notice that when the discount rate is lower than the internal rate of return, our NPV is positive (as shown in the first example above). Conversely, when the discount rate is higher than the IRR, the resulting net present value is negative (as shown in the second example above).
Intuitively, this makes sense if you think about the discount rate as your required rate of return. The IRR tells us what “return” we get based on a certain set of cash flows. If our required rate of return (discount rate) is higher than the IRR, then that means we want to earn more on the set of cash flows than we actually earn (the IRR). So, for us to earn more on a given set of cash flows, we have to pay less to acquire those cash flows. How much less? Exactly the amount of the net present value.
Let’s take a final example to see what happens when the discount rate is exactly equal to the IRR:
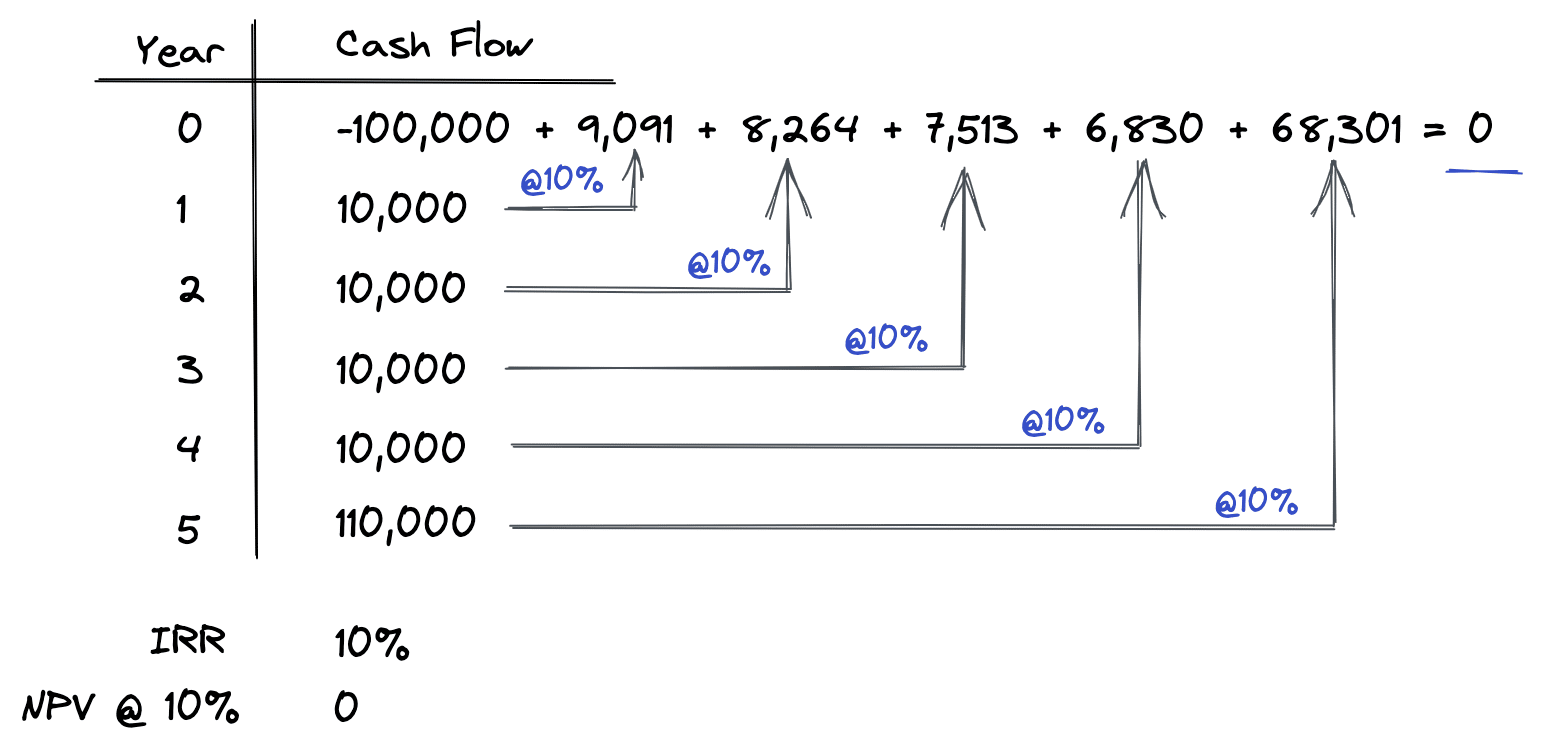
As shown above, when the discount rate is exactly equal to the IRR, then the resulting NPV is exactly equal to zero. Why is this? Well, intuitively if you think about the IRR as the actual return you get from a given set of cash flows, and the discount rate as what you want the return to be from the same set of cash flows, then when these are both equal, NPV will be zero.
This means what you want to earn on an investment (discount rate) is exactly equal to what the investment’s cash flows actually yield (IRR), and therefore value is equal to cost.
To actually perform the NPV calculation itself, you can use an NPV calculator, financial calculator, or the NPV function in Excel, which we will take a look at next.
Introducing CRE Investment Analysis Fundamentals
A complete online course that teaches you the entire commercial real estate investment analysis process
A big picture overview of the commercial real estate investment analysis process
A step-by-step walkthrough of the real estate proforma
How to calculate and interpret simple measures of investment performance
A complete time value of money crash course
A walkthrough of the intuition and calculations behind IRR and NPV
How commercial real estate loans work, including a lender comparison spreadsheet
Office building case study with 5-year proforma, ratios, and discounted cash flow analysis
Fully unlocked Excel models included
60-day money-back guarantee
How to calculate NPV in Excel
Calculating NPV in Excel is commonly misunderstood. The reason why is that the NPV formula in Excel does not actually calculate the net present value. Instead, the NPV formula in Excel actually calculates the present value, which means you have to manually subtract out the time 0 cash outflow to calculate the NPV in Excel.
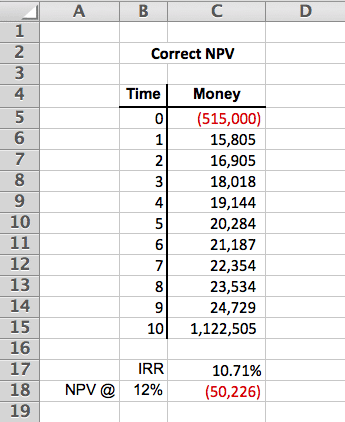
The above NPV calculation is excel uses the following formula:
=NPV(B18,C6:C15)+C5
Notice how the Time 0 value in cell C5 is manually added to the present value calculated by the NPV formula in Excel. Since the Time 0 value is negative, that means we can add it to the result of the Excel NPV calculation, and it will then provide us with the present value minus the present cost, which is the net present value.
NPV Calculator
Fill out the quick form below and we’ll email you our free NPV calculator. You can use our NPV calculator to quickly calculate NPV for any holding period you need. You can also visualize what your cash flows are doing in each period of the analysis.
Conclusion
What is NPV? In this article, we discussed what NPV is, what NPV means, the NPV decision rule, the importance of the discount rate, and how NPV is calculated. We also covered some common misconceptions and mistakes and reviewed several relevant examples along the way. Once you understand how NPV works step-by-step, it’s easy to see that NPV is simply value minus cost.