A detailed market analysis is key to any real estate investment decision. Even though the financial projections have far more impact in management and investment decisions, market analysis is behind each and every number in the financial statements. So, it is important to take the time to gather the data required to fully understand the subject property’s market area. In the end, the quality of the market analysis can make a difference in accurately determining whether or not a property is a feasible, profitable investment.
Defining The Market Area For a Property
The first step in creating a market analysis is to define the market area of the subject property. The market area is the most probable geographic area that the subject property will service. The size of the market area is dependent upon the type of property it is and the service it provides. For example, the market area of a convenience store is relatively small. The majority of the customers the convenience store serves typically live in less than a one-mile radius of its location. On the other hand, a larger community center development may include a variety of retail stores and offices that serve an area within around a ten-mile radius.
Typically, the general market area is the smallest geographic area that has publicly accessible economic and demographic data. The neighborhood is the area that includes any major competitors to the subject property. Consider where the subject property’s neighborhood is in the neighborhood life cycle. The life cycle contains four stages. In the growth stage, there is a lot of new construction, and the population in the area increases at an above-average rate compared to other neighborhoods in the area.
At some point, however, the growth rate slows, the neighborhood becomes fully developed, and the period of stability begins. Depending on development trends in the area along with the overall physical characteristics of the improvements, a neighborhood could remain in a relatively stable part of its cycle for a long time. During this period, vacancy rates are stable, and prices generally increase along with the national average.
Eventually, the neighborhood will begin to decline as the economic welfare of the area declines or the real estate begins to fall into disrepair. This stage is characterized by falling property values and high vacancy rates.
Often with some local government intervention, however, the neighborhood undergoes revitalization. Urban renewal or gentrification efforts bring new residents and businesses into a neighborhood in which prices are at their lowest levels. Businesses and residents are enticed into the area by the low prices along with promises of tax breaks. If successful, a neighborhood can begin the life cycle again by transitioning into a new growth phase.
Population trends can help illustrate these changes in the neighborhood. Trends in census data over time help to tell the story of the area. The market analysis should consider the population size, household size, age distribution, marital status, education level, and employment rate for the residents in the area. Population growth is fueled by economic and employment growth. In some areas, however, population growth is fueled immigration or retirement destinations in warmer locations. Population growth of this kind can bring both unique opportunities and challenges into an area, and it is important to consider those long-term implications.
Gathering Data for a Real Estate Market Analysis
There are many good data sources available for free online to assist with a demographic analysis. The U.S. Census Bureau provides extensive population and demographic data, but the only problem is the gap in the data points, since they only gather data every ten years. The Federal Reserve collects economic and financial data, and the Department of Housing and Urban Development provides access to housing data. Depending on the size of the area and the level of detail needed for the market analysis, private sources of data may be required. There are a variety of companies that provide demographic and economic data for a fee.
| Type of Data | Sources of Data |
|---|---|
| Population size and demographics | US Census Bureau |
| Unemployment rate | Bureau of Labor Statistics |
| Household income | Bureau of Labor Statistics; US Census Bureau |
| Housing prices | FRED economic research; HUD |
| Interest rates | FRED economic research |
| Daily traffic counts | Data.gov |
| Public schools | Data.gov |
| Building permits | Data.gov; Local city offices |
| Commercial real estate sales | Costar; LoopNet |
For example, here are some demographic data comparing the population of Orlando to both the state of Florida and the United States overall. One of the first observations about Orlando is that the population is comparatively young and more likely to speak Spanish compared to other parts of the state and the country. The area is densely populated. The demographic section of the market analysis would include additional data about education, age, and income over time. Growth rates illustrate the dynamic population characteristics of an area.
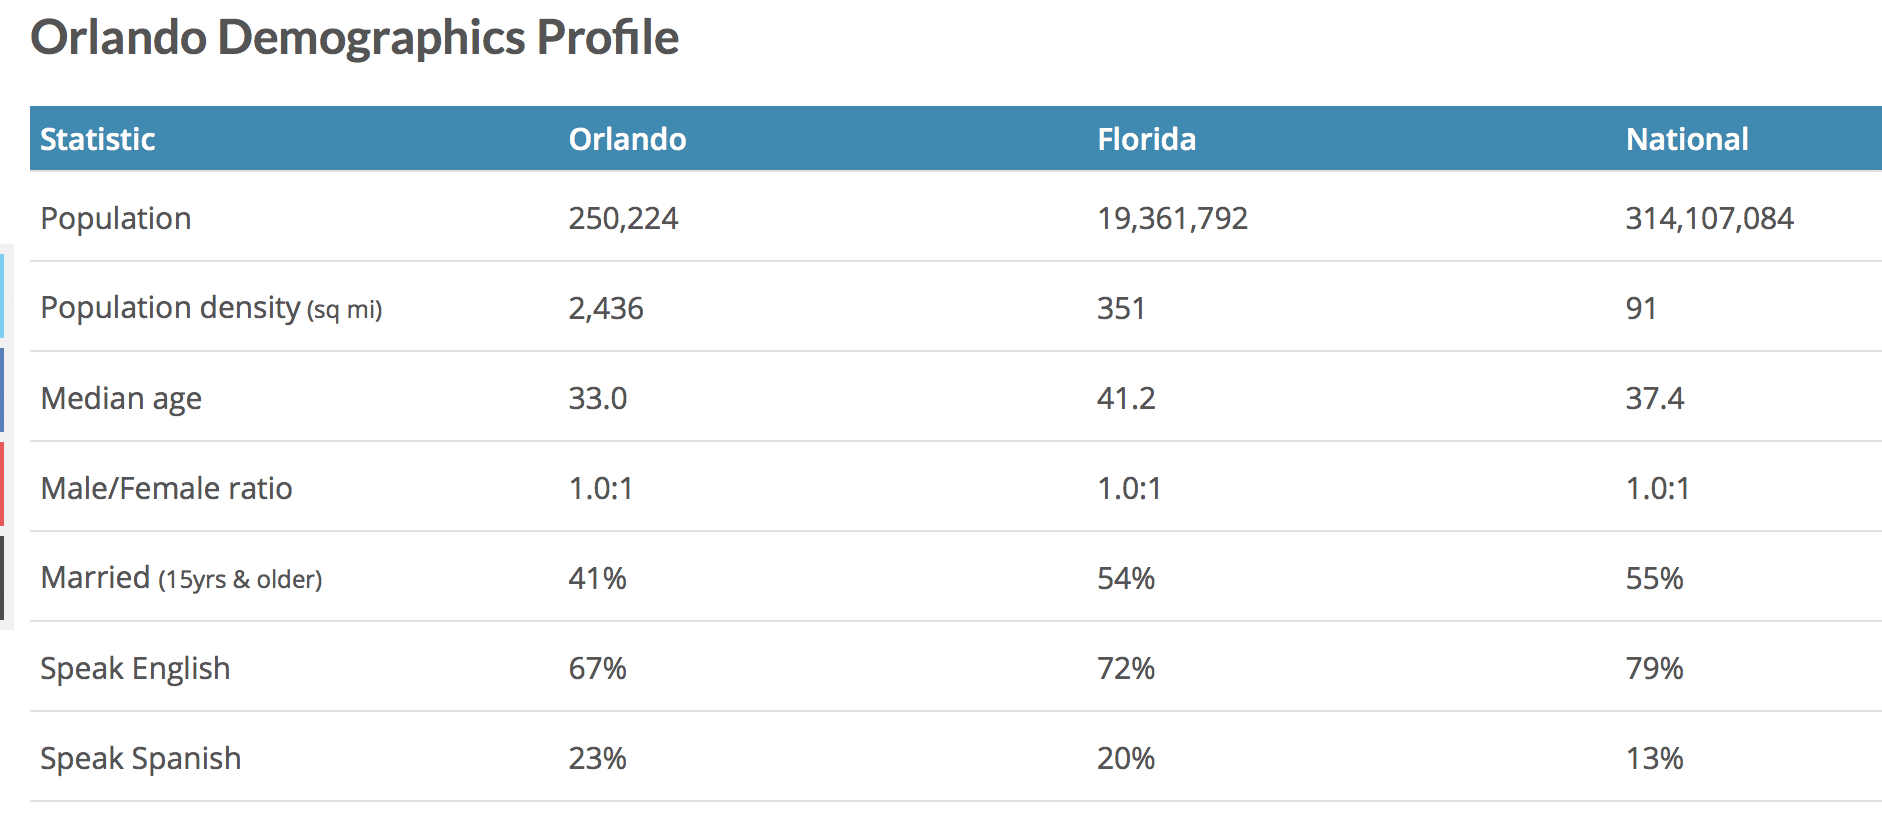
Population trends are an important component of understanding the real estate market in an area. Specific demographic groups have shopping preferences that can influence retail development. Populations with an older average age may need more office space and medical facilities. Areas with young or transient populations may need more of the overall housing supply dedicated to apartments and condominiums.
In addition to analyzing the population and economics of the market area and neighborhood, it is important to analyze the competition. What other properties in the area are supplying the space market for a particular property type? Find out what rental rates competitors charge and their average vacancy rate. Consult the public records in the area to find if there are any permits for new construction in the area that will also change the current supply levels and create additional sources of competition for buyers and tenants.
Modeling Supply and Demand For a Real Estate Market Analysis
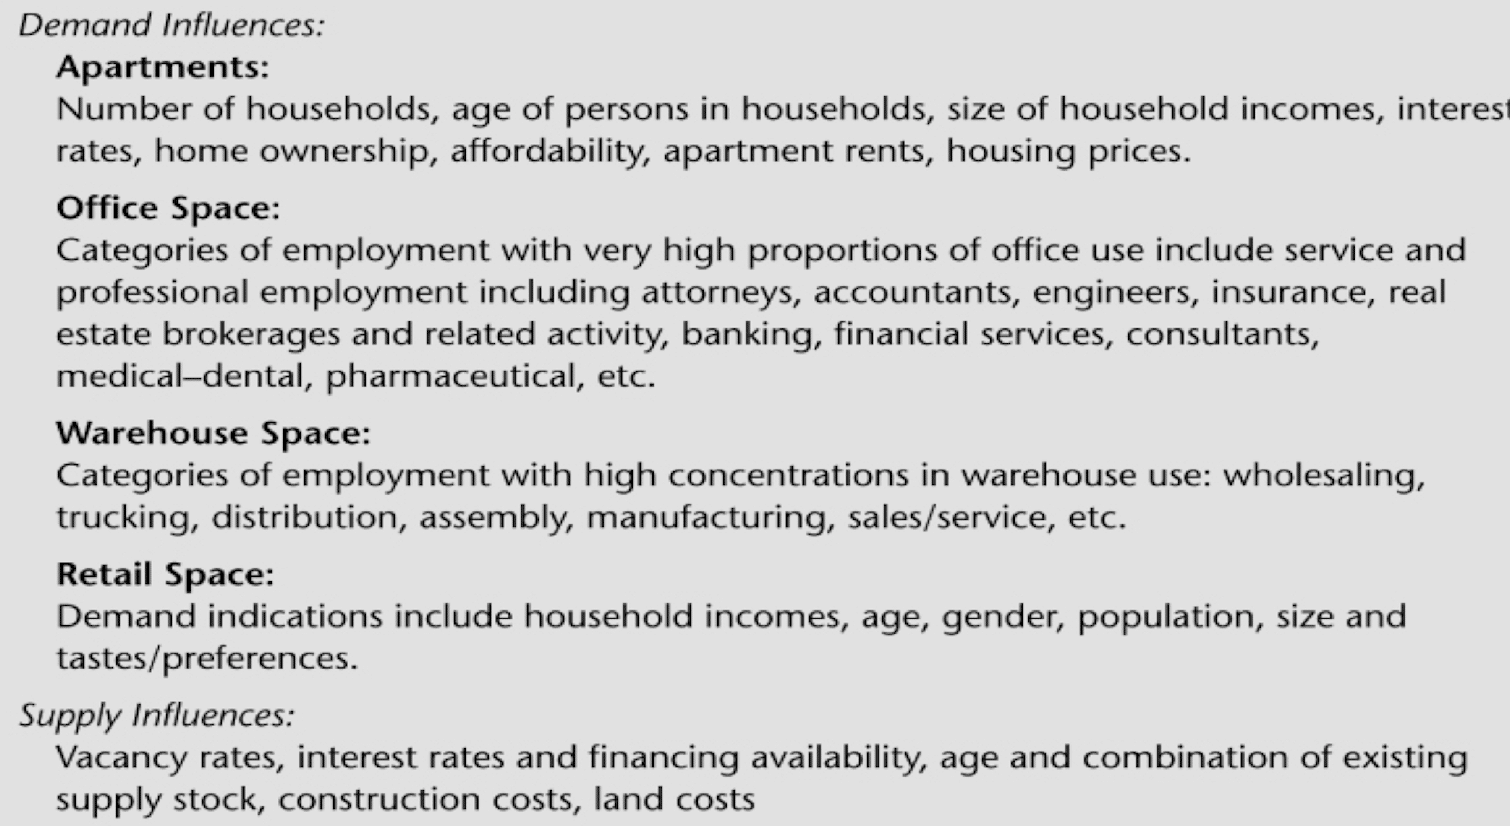
Organizations such as the Urban Land Institute publish statistics such as the typical retail sales per square foot across the country. After researching the typical per capita sales or per capita demand for the subject property type, research the current sales volume and rents for competitors in the market area. The population data forecasts expected demand based off growth expectations. The current real estate data show whether the existing supply of real estate is less than, greater than, or matching the current and projected national average sales or demand per square foot of space. Although the influences on supply are generally the same across property types, the demand influences can differ across commercial property types.
For instance, consider and example neighborhood with a population growth rate of a steady 3%, and a projected population of around 27,500. Multiply that population by the national forecasted per capita sales in the next year. If projected per capita sales for a specific type of retail store was $175, sales demand in the area would be $4,812,500 next year.
Then, divide that sales demand by the typical sales per square foot for similar stores around the country. If the average store had typical sales of $140 per square foot, that would equal a square footage demand in the area of 34,375 square feet. Consider whether the market area currently has less than or greater than that amount of square footage devoted to serving this demand. If demand is greater than the current supply, current owners may earn higher than average per capita sales, but there is also room for the market to absorb additional supply of real estate. If demand is less than current supply, the market tends to have lower than average sales and rents along with higher than average vacancy rates. Population demographics also determine suitable absorption rates for new developments, which is the length of time it takes to reach a stabilized occupancy level for a new commercial property.
The Multiplier Effect in Real Estate Market Analysis
The multiplier effect describes the propensity for economic activity to lead to job growth, population growth, and rising income levels in a region. This is why a real estate market analysis needs to include information about the population and the industries that create the local economy. In general, the higher the skill and education level requirements of the industry, the greater the multiplier effect is on the local economy. For that reason, areas with a strong technology presence are considered to benefit the most from the multiplier effect. Industries that require relatively low skill and low levels of education also have the lowest multiplier effects. Forecasting potential growth in the demand for particular types of real estate should consider the impact of economic growth in local industry along with its propensity to create new jobs and higher income for the region. The multiplier effect models changes in aggregate demand caused by cash injections into the local economy.
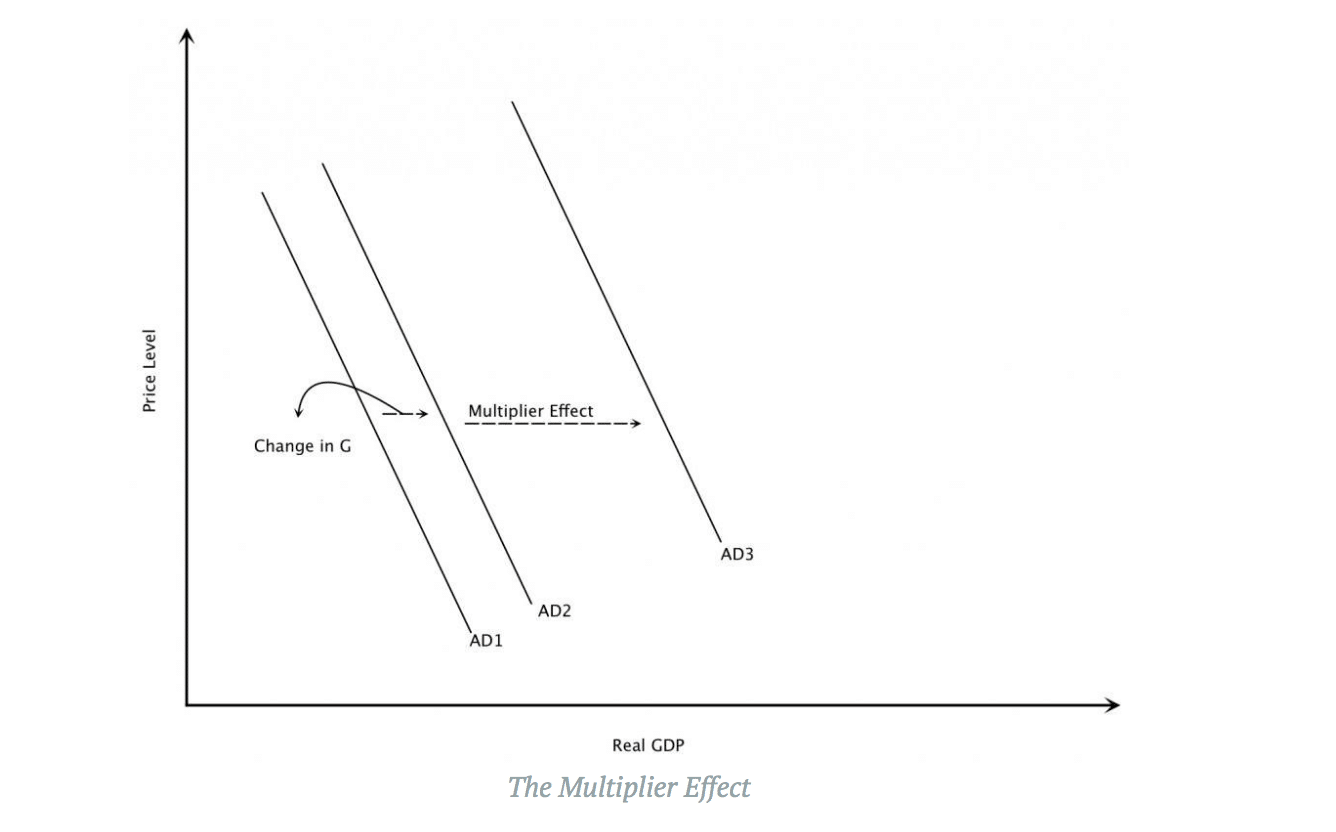
The intensity of the multiplier effect is represented by the change in real GDP divided by the change in the amount of cash injected into the economy.
Multiplier (k) = change in real GDP / change in cash injections
In a simple economy, the multiplier can also be represented as a function of the population’s marginal propensity to consume and marginal propensity to save. Where the marginal propensity to save is 10% and marginal propensity to consume is 90%, the multiplier effect is 10.
k = 1/marginal propensity to save = 1/.1 = 10
k = 1 / (1-marginal propensity to consume) = 1 / (1-.9) = 10
For example, a cash injection of $100,000 into the economy gets paid out as wages and then spent in the local economy on goods and services. Local businesses then pay that money out as wages, which in turn results in more spending on goods and services. If the multiplier effect is equal to 10, it means this $100,000 additional cash injection ultimately results in $1,000,000 of effective income into the region.
Tobin’s q and Real Estate Market Analysis
Although the idea of Tobin’s q was originally established to describe a firm’s decisions regarding investment in capital assets, the theory can be expanded to describe investment in real estate. The original equation for Tobin’s q was:
Tobin’s q = market value of reproducible real capital assets/current replacement cost of assets.
In real estate, the cost of reproduction is defined by an appraiser’s cost approach to valuation. So, Tobin’s q can be generalized to apply to real estate assets using the following equation:
Q = market price of existing real estate/cost of land + improvements’ construction cost.
Applying this theory to real estate and urban development, the market has the capacity to absorb additional supply if the construction is creating additional value. Mathematically, this is true any time q>1. When this is true, developers have the ability to earn enough profit to make new construction projects financially feasible. When that new inventory becomes available on the market, however, the market value of similar real estate assets will fall until the demand grows to meet the new supply. When market prices decline due to the new supply, the value of Tobin’s q also decreases. So, Tobin’s q is a useful tool for evaluating current supply and demand conditions for real estate market segments and the impact new development has on the current space market.
Conclusion
In this article, we briefly outlined at a high level the steps taken to complete a real estate market analysis. The first task is to define the market area, which is the geographic area a property is expected to service. Then, we discussed how and where to gather relevant market data for a property. And finally, we discussed supply and demand factors to consider, including the multiplier effect and Tobins q. Real estate market analysis is a complicated subject, and this article gives a high-level overview on how to get started.