Understanding the cash on cash return in commercial real estate is important when you are evaluating investment real estate transactions. What is the cash on cash return, and how do you calculate it for a commercial property? What are the nuances and limitations of the cash on cash return? In this article, we’ll tackle these questions in depth and also provide some detailed examples along the way.
Table of Contents:
- What is Cash on Cash Return
- Cash on Cash Return Formula
- How to Calculate Cash on Cash Return
- What Does the Cash on Cash Return Mean
- What is a Good Cash on Cash Return
- Cash on Cash Return Requirements by Property Type
- Cash on Cash Return Limitations
- Cash on Cash Return vs IRR
- Cash on Cash Return vs ROI
- Cash on Cash Return vs Cap Rate
- Does Cash on Cash Return Include Principal?
What is Cash on Cash Return
The cash on cash return is a commonly used return metric in commercial real estate analysis. It is expressed as a percentage and measures the income earned in a single period, such as a year, on the cash invested into a property.
The cash on cash return can also be referred to as the equity dividend rate and is a component of the band of investment method used by appraisers to calculate the cap rate.
Cash on Cash Return Formula
Before diving into some cash on cash return examples, it is important to have a sound understanding of what the term “cash on cash return” means. So, let’s start with the basics. First, here’s the cash on cash return formula:
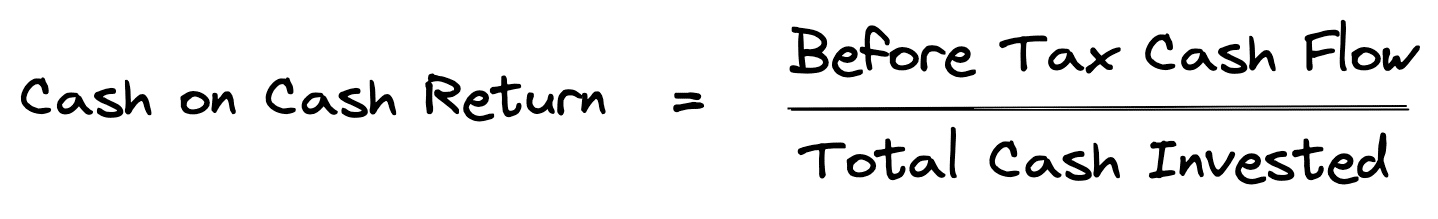
As shown in the cash on cash formula above, the cash on cash return is defined as cash flow before tax divided by the total equity invested. The cash flow before tax figure used in the formula is calculated on the real estate proforma. The total cash invested figure used in the above equation is the initial equity investment, which is the total purchase price of the property less any loan proceeds and transaction costs, plus any additional equity required during the holding period.
Note that this is the cash on cash return formula, as it is typically used. However, it is not uncommon to see variations on this definition. For example, the cash flow figure in the numerator of the equation above could be calculated using cash flow before tax, as shown. But it could also be calculated using cash flow after tax, or it might be based on cash flow with leverage (debt) or without leverage. This is why it is important to clarify how terms are being defined, and most importantly, to make sure measures are consistent when making comparisons.
How to Calculate Cash on Cash Return
The cash on cash return can be calculated by taking a single period’s cash flow and dividing it by the total cash invested into a property. For example, suppose we have the following proforma:
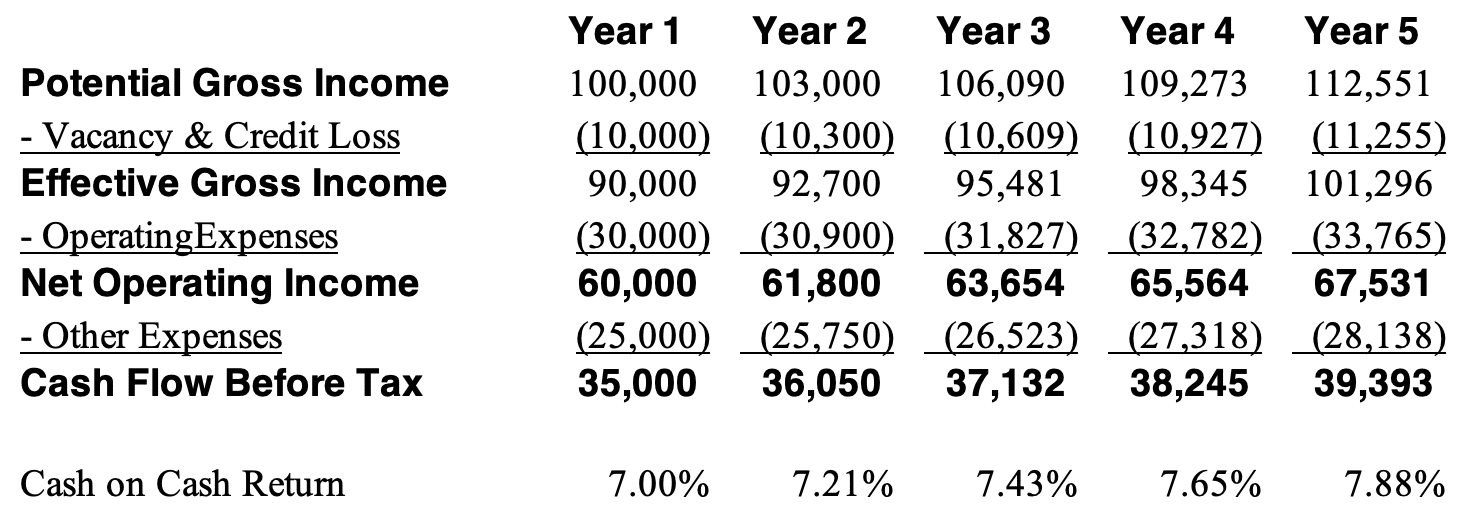
If the total cash invested was 500,000 then the year 1 cash on cash return would be 35,000 / 500,000, or 7.00%. And the year 2 cash on cash return would be 36,050 / 500,000, or 7.21%.
If additional equity is invested after the initial cash used to purchase the property, then there may be variations on how you see the cash on cash return calculation. For example, suppose our proforma looked like this with an additional 100,000 capital expenditure for a renovation in year 3:
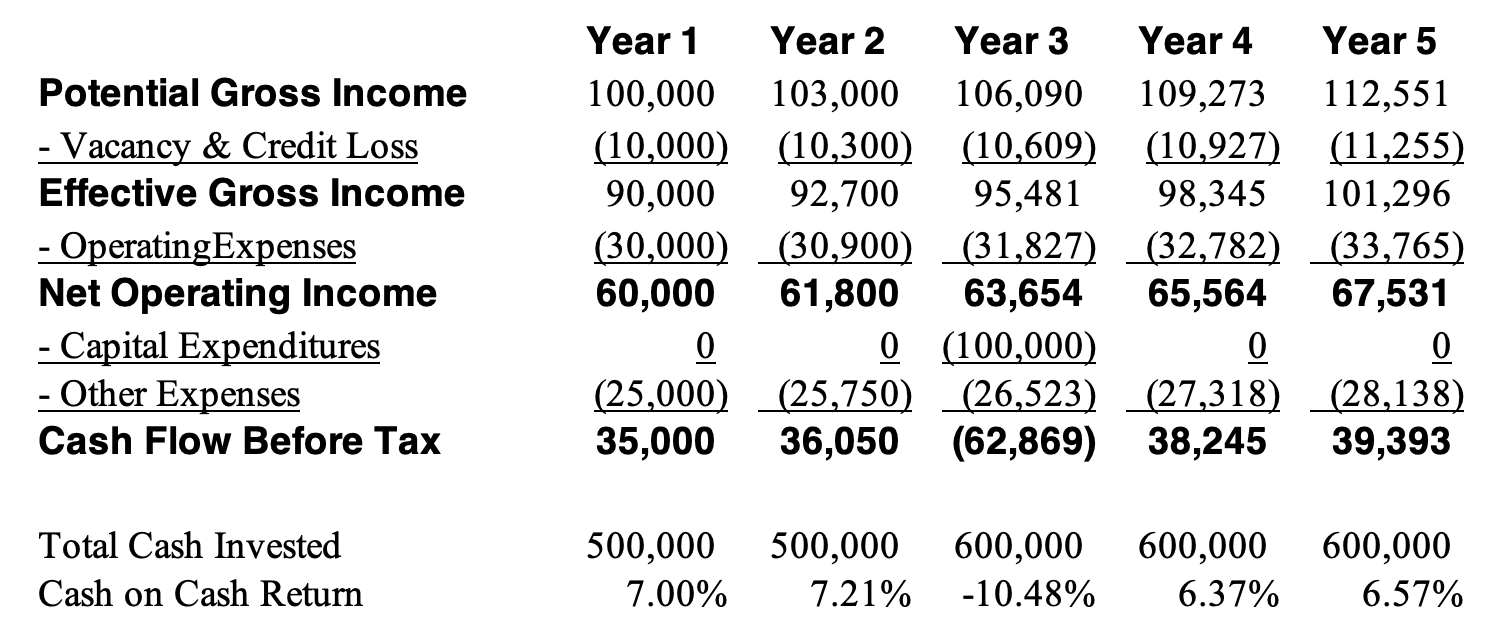
In this case, our total cash invested goes from the initial equity investment of 500,000 to the total cash invested of 600,000 after the 100,000 capital expenditure in year 3. The cash on cash return in year 3 in our example above is based on the (62,869) cash flow before tax and the 600,000 total cash invested, which results in a year 3 cash on cash return of -10.48%.
However, sometimes you might see the cash on cash return in a scenario like this calculated in other ways. One way the cash on cash return might be calculated is by using only the initial equity amount of 500,000. Another way the cash on cash return might be calculated is with the current year cash flow before tax, but the trailing total cash invested for the prior year. For instance, in our example above this would be (62,869) divided by 500,000, or -12.57%.
As you can see, although the cash on cash return calculation is fairly straightforward, there could still be some nuance to how it is performed. This is why it’s important to clarify how the cash on cash calculation will be performed and to apply this methodology consistently when making comparisons.
What Does Cash on Cash Return Mean?
Next, let’s take a simple example to illustrate what the cash on cash return means. Suppose you are evaluating an office building with an estimated Year 1 Cash Flow Before Tax of $60,000. Furthermore, assume that the negotiated purchase price of the property is $1,200,000, and you can secure a loan for $900,000 (75% Loan to Value). What’s your cash on cash return for year 1?
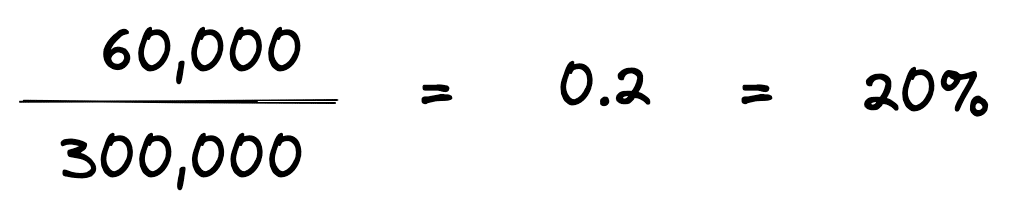
The calculation itself is pretty simple – your cash on cash return for year 1 would be the Year 1 cash flow divided by your total cash out of pocket, which equals 20%. So, what does this cash on cash return mean? Using only the figures above, the cash on cash return tells you that your year 1 return on investment is 20%.
What is a Good Cash on Cash Return
A good cash on cash return is one that is equal to or greater than your minimum cash on cash return requirements. For example, if you were targeting a minimum of a 10% cash on cash return, but a project generated at most a 7% cash on cash return, then this would not be a good cash on cash return based on your objectives.
With that said, there is no silver bullet when it comes to investment analysis, so all relevant factors should be considered. This includes your overall investment objectives, strategy, risks, time horizon, and more. The cash on cash return can be helpful when evaluating an investment, but it does have some limitations and shouldn’t be used in isolation.
Cash-on-Cash Return Requirements by Property Type
Investor surveys in 2024 indicate that required cash-on-cash returns (equity dividend rates) have risen into the high-single-digit range on average. Many investors now target 8% or higher cash yields on equity for acquisitions. Below is a breakdown of typical 2024 cash-on-cash return expectations by major property type:
| Property Type | Subcategory | 2024 Cash-on-Cash Return Requirement |
|---|---|---|
| Office | Prime (Class A) | 7%–8% |
| Lower-Quality (Class B/C) | 10%–14% | |
| Retail | Neighborhood/Community Centers | 8%–10% |
| Regional Malls | 14%+ | |
| Industrial | Modern (Light Industrial/R&D) | 8.5%–9.0% |
| Older/Heavy Industrial | 11%–12% | |
| Multifamily (Apartments) | New/Core Apartments | 6%–8% |
| Value-Add/Older Apartments | 8%–9% | |
| Hospitality (Hotels) | Full-Service & Limited-Service | 10%–12%+ |
| Lower-Tier Hotels/Motels | 12%–15%+ |
This data is sourced from U.S. investor survey reports and reflects actual nationwide average return expectations. The spread in required returns across property types is driven by varying risk profiles and income stability.
Cash on Cash Return Limitations
The cash on cash return is a simple measure of investment performance that is quick and easy. It can be a good starting point for quickly filtering out potential investment properties. But don’t be fooled by the many limitations of the cash on cash return.
Consider the following series of cash flows:
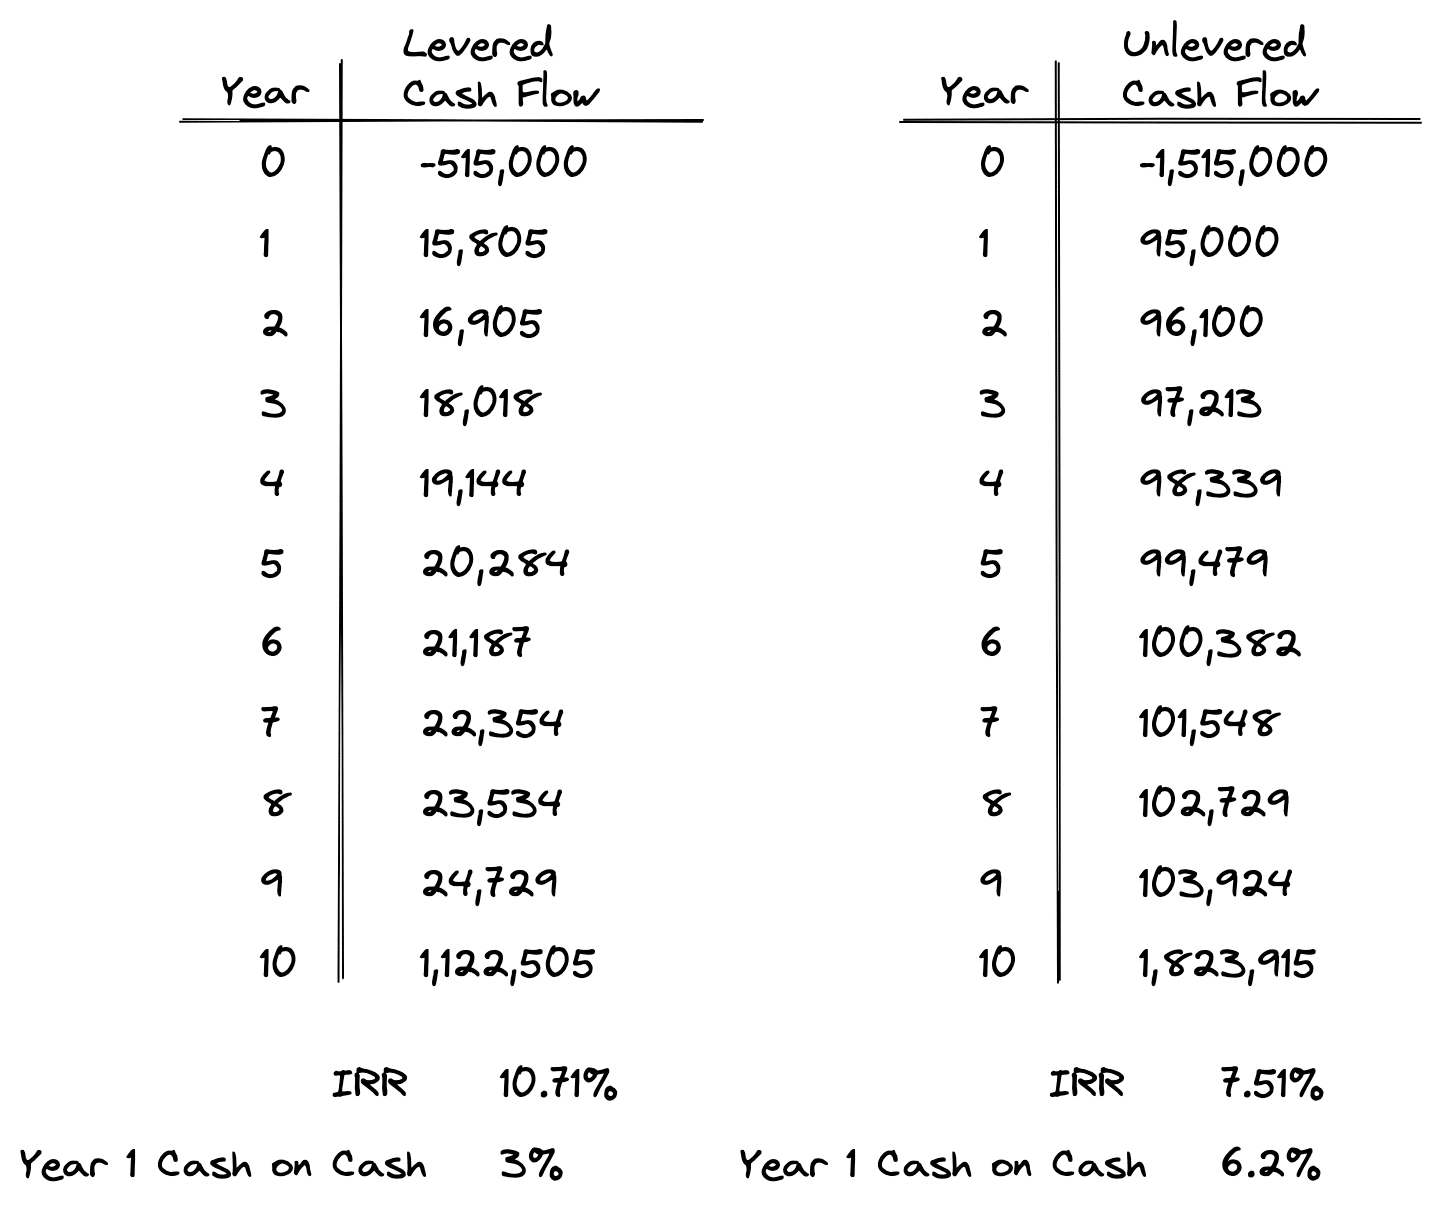
The year 1 cash on cash return in the levered example above shows a 3% cash on cash return. Levered just means the cash flows include debt, also known as leverage. To find this, simply take the end of year (EOY) 1 cash flow of $15,805 and divide it by the initial equity investment of $515,000.
But as illustrated by the table above, the internal rate of return (IRR) is 10.71%. This suggests that based on a discounted cash flow analysis, the investment is actually much better (almost 4x better) than what’s indicated by the cash on cash return. If you were only using the cash on cash return as an investment filter, then you’d pass up this opportunity to earn nearly 11%.
The reason the cash on cash return is so much lower than the IRR in the example above is because the cash on cash return ignores the other 9 years of operating cash flows in the holding period. Plus, it also ignores the reversion cash flow at the end of year 10 that comes from the sale of the asset. Without considering these additional cash flows that occur over the holding period, it’s impossible for the cash on cash return to accurately reflect the return characteristics of the property.
The same is true when looking at the unlevered (without debt) example above. The cash on cash return in the unlevered series of cash flows above is 6.2% ($95,000 divided by $1,515,000), and the IRR is 7.51%. This series of cash flows doesn’t produce as big of a gap as in the levered example, but it’s still a difference. Without considering all cash flows over the holding period, the gap between the cash on cash return and the IRR will be unknown.
Keep in mind that this can work in reverse too. In the above examples, the IRR was higher than the cash on cash return because operating cash flows grow over the holding period and the sales proceeds of the asset are favorable. But it could also be the case that many leases will expire a few years after acquisition, causing operating cash flow to decline and the final reversion cash flow to be lower. This could produce the opposite result, where the cash on cash return ends up being more favorable than the IRR.
Cash on Cash Return vs IRR
As mentioned in the section above, the cash on cash return and internal rate of return (IRR) are two different measures of investment performance. The most significant difference between the cash on cash return and IRR is that the cash on cash return only considers cash flow from a single year, whereas the IRR considers all cash flows during the entire holding period.
Since the cash on cash return and the IRR are two different measures, which one is better? As always, that depends on your investment objectives. That’s why it’s useful to look at a variety of metrics for a property to make an informed decision.
Let’s take a look at an example that shows why using both the cash on cash return and the internal rate of return can be helpful. Consider the following two sets of cash flows:
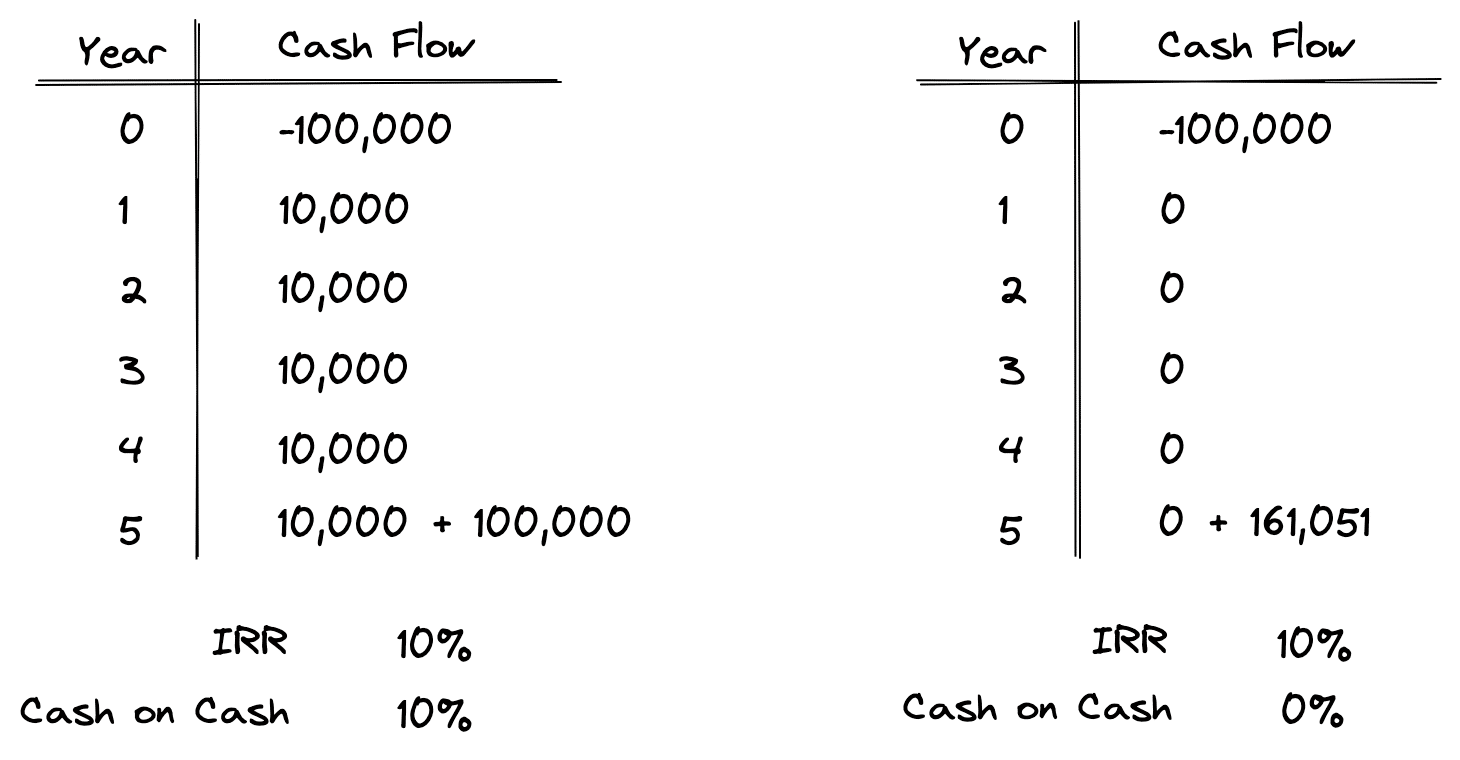
In the top left example, you can see that the cash on cash return is 10% in each year of the holding period. This is calculated by taking the cash flow of $10,000 in each year of the holding period and dividing it by the initial investment of $100,000.
The top right example, on the other hand, has a 0% cash on cash return each year because it doesn’t produce any cash flow until the asset is sold at the end of the holding period.
But notice that both investments have a 10% internal rate of return. So, which investment is better? This ultimately comes down to your investment objectives.
Investment #1 produces stable, predictable, and perhaps taxable cash flows in each year of the holding period. Investment #2 produces no cash flow until the sale of the asset at the end of year 5.
As you can see, using the cash on cash return in addition to the internal rate of return can help quantify these differences to inform your decisions. Other metrics can also help paint the picture and show you the nuance of an investment. These metrics include the internal rate of return, net present value, gross rent multiplier, cap rate, operating expense ratio, equity multiple, and more.
Introducing CRE Investment Analysis Fundamentals
A complete online course that teaches you the entire commercial real estate investment analysis process
A big picture overview of the commercial real estate investment analysis process
A step-by-step walkthrough of the real estate proforma
How to calculate and interpret simple measures of investment performance
A complete time value of money crash course
A walkthrough of the intuition and calculations behind IRR and NPV
How commercial real estate loans work, including a lender comparison spreadsheet
Office building case study with 5-year proforma, ratios, and discounted cash flow analysis
Fully unlocked Excel models included
60-day money-back guarantee
Cash on Cash Return vs ROI
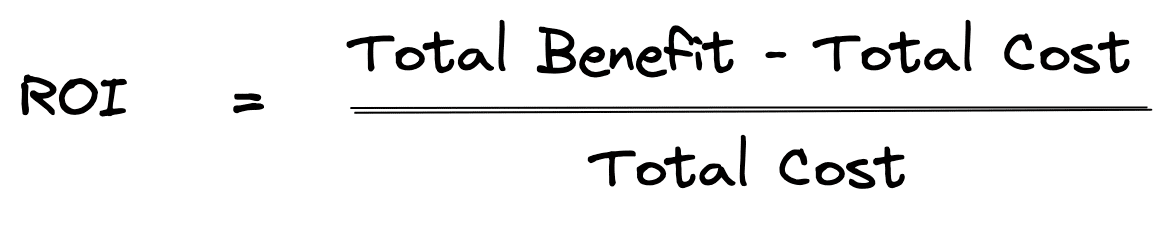
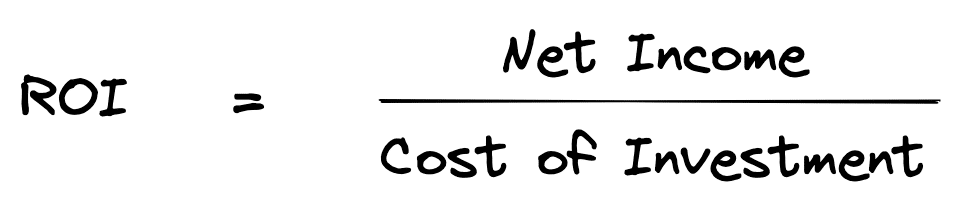
What’s the difference between the cash on cash return and return on investment (ROI)? To understand this difference, it’s first important to clarify what ROI means. ROI is a common term used in business and investment. But the term “return on investment”, or “ROI”, can also be defined in various ways, which sometimes makes it confusing to understand.
One way return on investment or ROI can be defined is that it’s the total gain of an investment divided by the total cost of the investment:
For example, suppose an investor purchased a parcel of land for $1,000,000, sold parking access each year during a large event to break even on all operating costs, and then after 2 years sold the investment and received net sales proceeds of $2,000,000. Using this method of calculating ROI, you would end up with a return on investment that look like this:
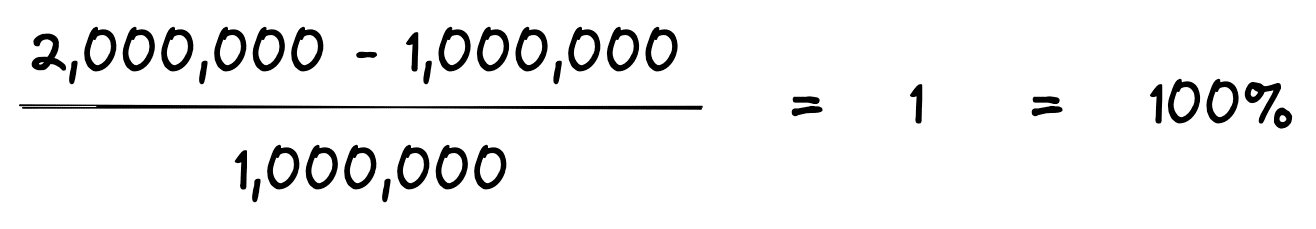
Of course, if this is how you are using ROI, then the cash on cash return would not be the same. The reason is that the above ROI formula uses total gain and cost over the entire life of the investment, whereas the cash on cash return only measures the return from a single period’s operating cash flow.
Another common way ROI is defined is that it’s net income in a particular year divided by the cost of the investment:
For instance, suppose we have the same example above where an investor buys a land parcel for $1,000,000, operates at breakeven, and then receives net sale proceeds for $2,000,000 at the end of year 2. If we were to use this net income-based variation of the ROI calculation, then we could calculate our ROI for year 1 as follows:
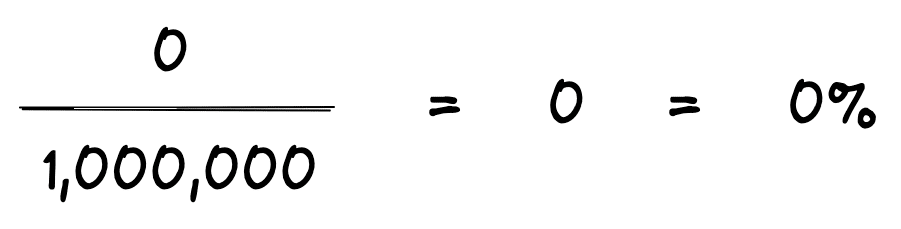
In other words, our year 1 ROI is 0%. This is the same result we’d get with a cash on cash return calculation for year one, and is subject to the same limitations discussed above.
At a high level, return on investment simply measures cost versus benefit. However, as discussed above, how “cost” and how “benefit” are defined will impact the results you get from an ROI calculation. That’s why it’s best to clarify terms and definitions, so you can be sure you are speaking the same language and ultimately comparing apples to apples.
Cash on Cash Return vs Cap Rate
What’s the difference between the cash on cash return and the capitalization rate? The cash on cash return and the cap rate are two different measures of investment performance. Both the cash on cash return and the cap rate are based on cash flow for a single year. However, each ratio uses a different measure of cash flow, and therefore the cash on cash return and the cap rate measure two different things.
The cash on cash return uses the cash flow before tax line item on a proforma, which is then divided by the total equity invested. The cap rate, on the other hand, uses the net operating income (NOI) line item on a proforma, which is then divided by the purchase price.
In other words, the cash on cash return is the return to the equity owners because it takes the cash flow available to equity holders and divides it by the total equity invested.
The cap rate, on the other hand, is the return on the property itself because it takes the net operating income from the property and divides it by the purchase price.
Although the cash on cash return and the cap rate measure different things, the cash on cash return is commonly used by appraisers to calculate a cap rate.
This is accomplished by using what’s known as the band of investment method. The band of investment method takes a cash on cash return and a mortgage constant, and then uses these factors to build up to a cap rate.
This is particularly useful when there is no market data available for comparable sales, which is common in secondary or tertiary markets, or when a market crash causes transaction volume to freeze up.
To calculate a cap rate using the band of investment method, appraisers will survey local investors and ask them what their required cash on cash return would be to invest in the subject property. Then the appraiser will survey local lenders and ask them what terms they would be willing to lend on for the subject property, which can be used to calculate a mortgage constant.
Using this survey data, the appraiser can then create a weighted average between the cash on cash return and the mortgage constant to calculate a cap rate.
For example, suppose we survey local lenders to find out their current loan terms for a property similar to the one we are evaluating. We learn that we can get a loan at a 75% loan to value ratio, amortized over 20 years, at 6%. We can now use this loan information to calculate a mortgage constant of 0.085972.
Furthermore, we also survey local investors and find out that they would on average need an 11% cash on cash return to consider investing in a property like the one we are evaluating.
Now we have everything we need to calculate a capitalization rate using the band of investment method. To complete this, we simply take a weighted average of the return to the typical lender and the return to the typical investor. In this case, it is (75% * 0.085972) + (25% * 11%), which equals 0.06448 + .02750, or 9.20%. This is our market-based cap rate using the band of investment method.
Does Cash on Cash Return Include Principal?
The cash on cash return is based on the cash flow before tax line item on a real estate proforma. The cash flow before tax is calculated after deducting the loan’s debt service, and in this sense it does consider both the principal and interest payments from a loan.
However, the cash on cash return does not consider any principal pay down that occurs over the term of a loan. For example, if you have a $1,000,000 loan at a 5% interest rate amortized over 20 years, then your annual debt service would be $79,194. And your loan balance after 10 years would be $622,215. That means you would have paid down the principal balance on your loan by $377,784 over 10 years ($1,000,000 – $622,215). Since the cash on cash return is based on a single year’s operating cash flow, it does not consider this principal pay down over the term of the loan.
The advantage of using the internal rate of return is that the IRR does consider this principal pay down in the form of your net sale proceeds. The net sales proceeds are simply the selling price of the asset, minus any transaction costs, minus any remaining loan balance.
This doesn’t mean the cash on cash return should be ignored. It just means that it shouldn’t be the only factor considered. Using the cash on cash return along with other metrics will help show the nuance of the opportunity.
Conclusion
In this article, we discussed the cash on cash return in depth. We defined the term cash on cash return and showed how to calculate the cash on cash return, including how the formula can vary in different situations. Then, we discussed what is a good cash on cash return, some limitations of the cash on cash return and reviewed how the cash on cash compares to the internal rate of return, capitalization rate, and return on investment. Finally, we discussed whether the cash on cash return calculation includes loan principal. The cash on cash return is a commonly used metric in commercial real estate, but it is not a silver bullet. As such, it is important to consider its limitations and nuances, as discussed in this article.