It’s common in the commercial real estate industry to use leverage, which means acquiring a property with debt rather than paying all cash. Positive leverage occurs when debt increases an investor’s rate of return. Negative leverage occurs when debt decreases an investor’s rate of return. At a high level, these leverage concepts are easy to understand. But there is a lot of nuance below the surface. In this article, we’ll take a deep dive into the concept of negative leverage, and clear up any confusion.
Table of Contents
- Rate of Return Definitions
- What is Negative Leverage?
- How to Calculate Negative Leverage
- Weighted Average Cost of Capital and Leverage Analysis
Rate of Return Definitions
First, since there are a lot of industry terms used when analyzing leverage, let’s review some definitions. We will be looking at leverage on a single year basis and a multi-year basis. In a single year analysis, we use capitalization rates. In a multi-year analysis, we use yield rates. It may be helpful to refer to these definitions as we work through some examples below.
Capitalization Rates
A capitalization rate is just a fraction used to express the relationship between income in a single year and the value of an asset.
The overall capitalization rate is the net operating income divided by the value of the property. This is usually just called the cap rate.
The mortgage capitalization rate is the annual debt service divided by the remaining principal balance of the loan. This is also known as the mortgage constant or debt constant.
The equity capitalization rate is the cash flow before tax in a single year divided by the equity investment. This is also known as the cash on cash return or equity dividend rate.
Yield Rates
A yield rate is a rate of return on capital, usually expressed as a compound annual percentage rate. A yield rate considers all expected property benefits, including proceeds from sale at the termination of the investment.
The overall yield rate is the internal rate of return on all property cash flows, including the proceeds from sale, at the end of the investment. This is also known as the interest rate, discount rate, or “return on” rate.
The mortgage yield rate is the internal rate of return on all cash flows to the lender, including loan payments, origination fees, prepayment penalties, balloon payments, etc. This is also known as the lender’s yield, or just the interest rate if there are no other points or charges.
The equity yield rate is the internal rate of return on all cash flows to the equity investment, including the proceeds from sale, at the end of the investment. This is also known as the interest rate, discount rate, or “return on” rate.
What is Negative Leverage?
There are three types of leverage: negative leverage, positive leverage, and neutral leverage. There are also two ways to analyze leverage: on a single year basis or on a multi-year basis.
For a single year analysis of leverage, the overall capitalization rate is compared to the mortgage capitalization rate to determine the type of leverage.

In a single year analysis:
- Negative leverage occurs when the overall capitalization rate is less than the mortgage capitalization rate. When this happens, the equity capitalization rate will be less than the overall capitalization rate.
- Neutral leverage occurs when the overall capitalization rate is equal to the mortgage capitalization rate. When this happens, the equity capitalization rate will be equal to the overall capitalization rate.
- Positive leverage occurs when the overall capitalization rate is greater than the mortgage capitalization rate. When this happens, the equity capitalization rate will be greater than the overall capitalization rate.
For a multi-year analysis of leverage, the overall yield rate is compared to the mortgage yield rate.

In a multi-year analysis:
- Negative leverage occurs when the overall yield rate is less than the mortgage yield rate. When this happens, the equity yield rate will be less than the overall yield rate.
- Neutral leverage occurs when the overall yield rate is equal to the mortgage yield rate. When this happens, the equity capitalization rate will be equal to the overall capitalization rate.
- Positive leverage occurs when the overall yield rate is greater than the mortgage yield rate. When this happens, the equity yield rate will be greater than the overall yield rate.
Next, let’s walk through some examples.
How to Calculate Negative Leverage
Let’s take a look at how to analyze leverage. First, we will consider leverage in a single year analysis. Then we will look at leverage on a multi-year basis.
Single Year Analysis
Consider the following single year proforma:
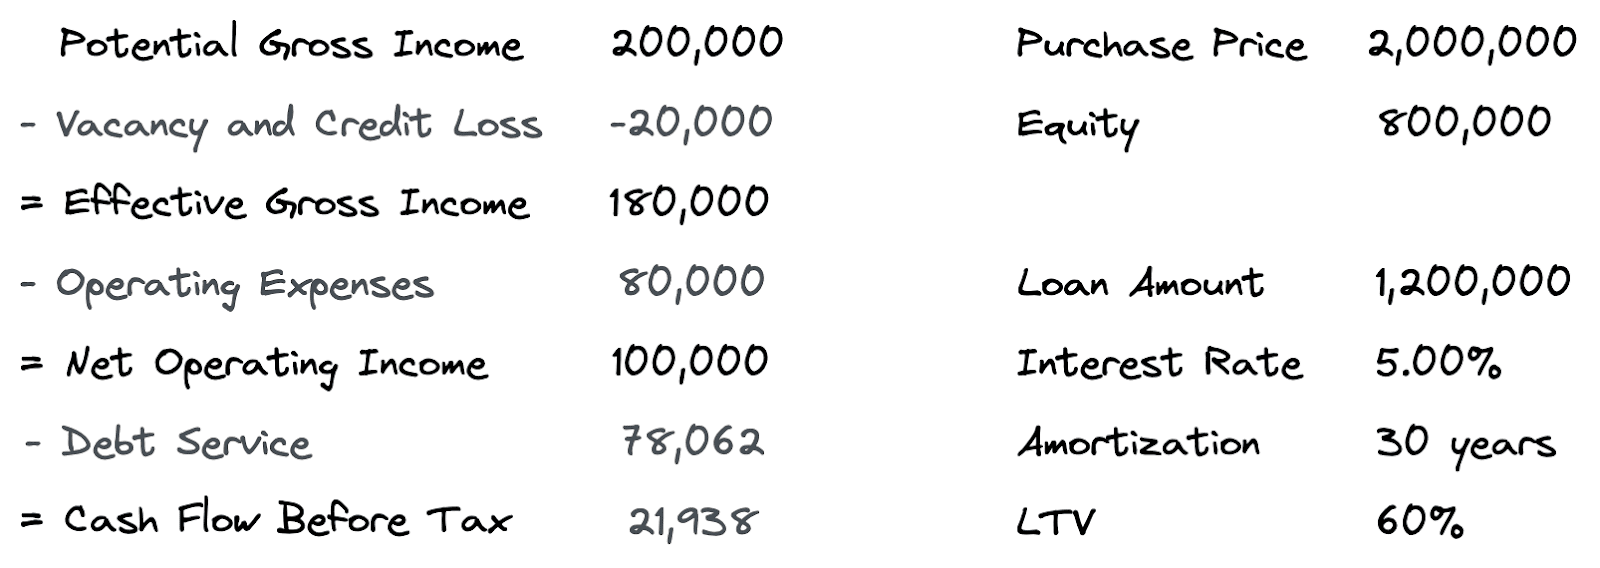
We have a 2,000,000 purchase price and a 1,200,000 loan amount. To keep the calculations simple, the loan has an annual interest rate of 5% and annual loan payments amortized over 30 years (not monthly). Using the information above, we can calculate the overall capitalization rate, the mortgage capitalization rate, and the equity capitalization rate.

Since the overall capitalization rate of 5.0% is less than the mortgage capitalization rate of 6.5%, that means on a single year basis, we have negative leverage.
Another way to see this is by looking at the equity capitalization rate, which is now almost half of the overall capitalization rate. In other words, if you buy this property without any debt, then you would earn a 5% cash on cash return. In this case, the cash flow before tax is equal to the net operating income, since there is no debt service. But if you buy this property using the loan, your cash on cash gets cut down to 2.7%. In fact, the more debt you add under this negative leverage condition, the lower the cash on cash return will be.
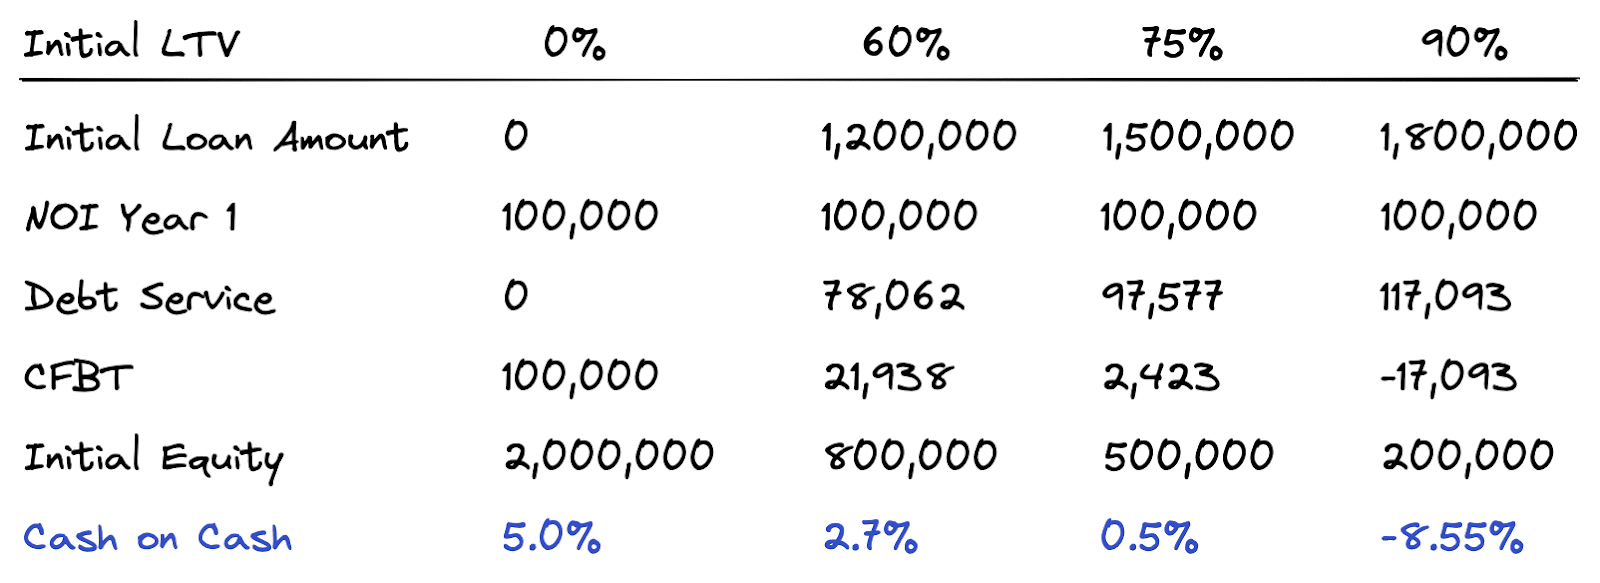
As illustrated in the table above, our cash on cash goes from 5% in a 0% loan to value scenario, down to -8.55% in a 90% loan to value scenario. If we instead had positive leverage, then the cash on cash return would increase as more debt is added to the property. If we had neutral leverage, then the return would not change at all.
Multi-Year Analysis
Let’s extend our single year example to a 5-year analysis.
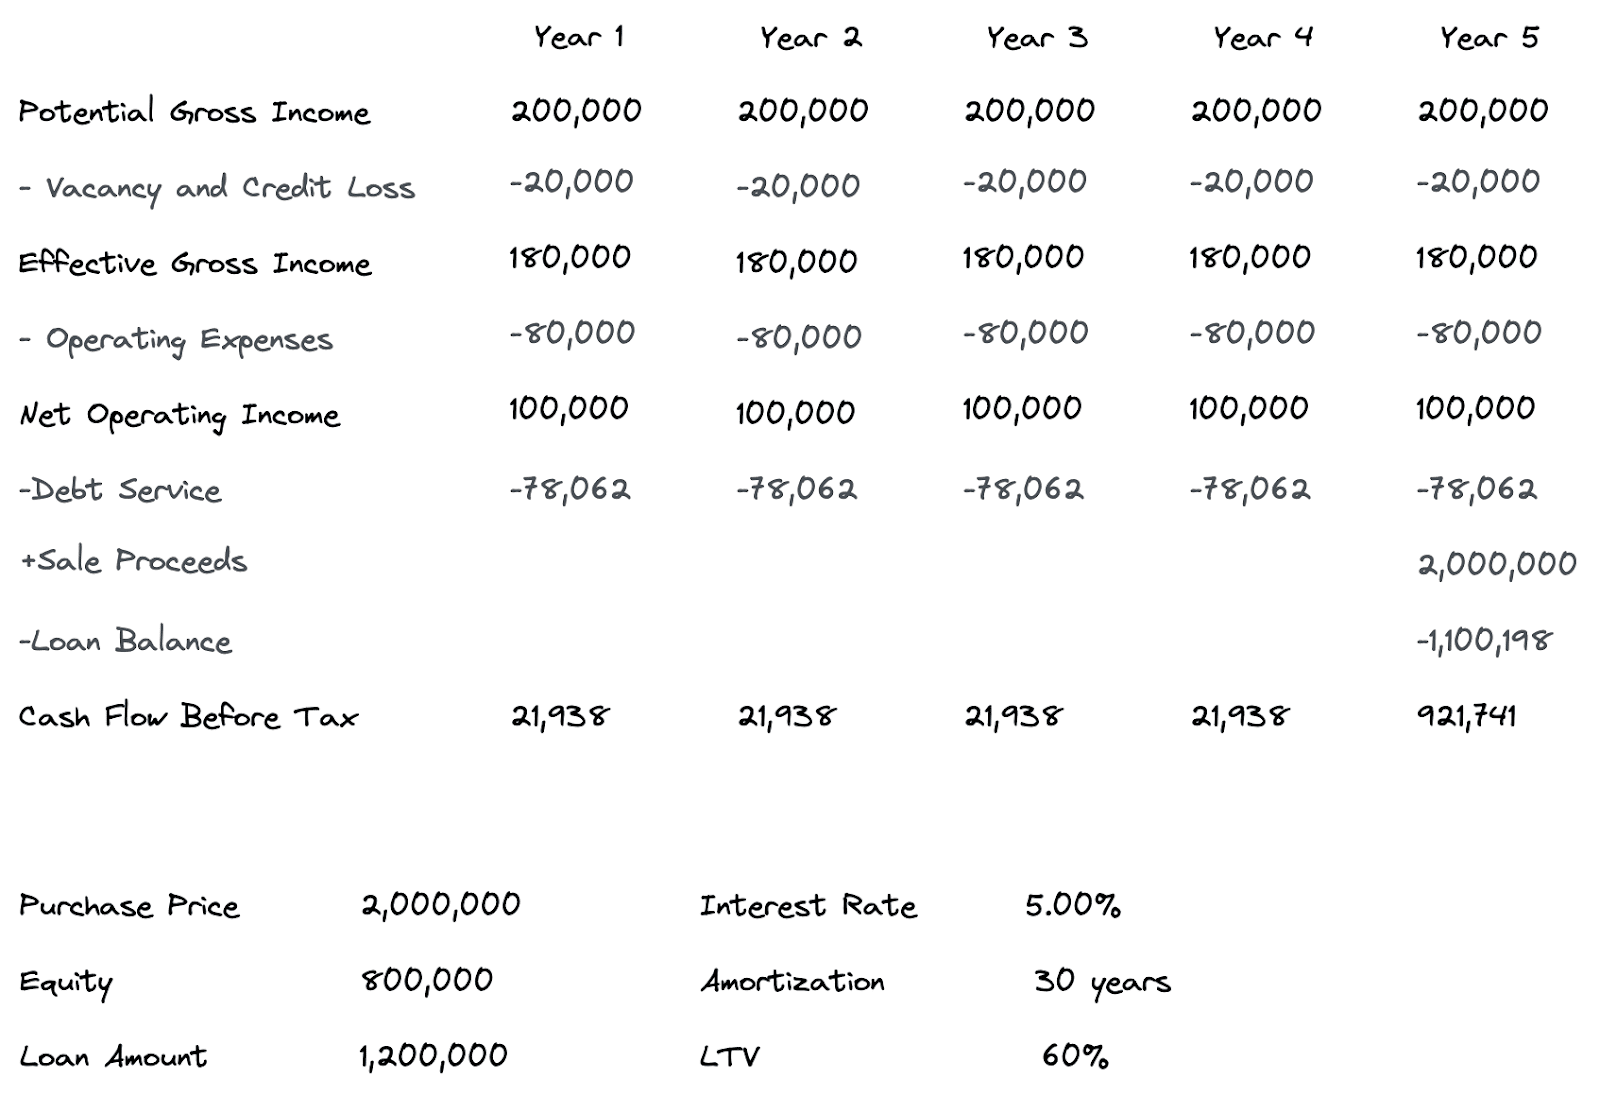
For this multi-year analysis, we are assuming zero NOI growth and zero appreciation.
We can now calculate the overall yield rate, the mortgage yield rate, and the equity yield rate. This can be accomplished by calculating the internal rate of return on the cash flows for the property, the loan, and the equity.
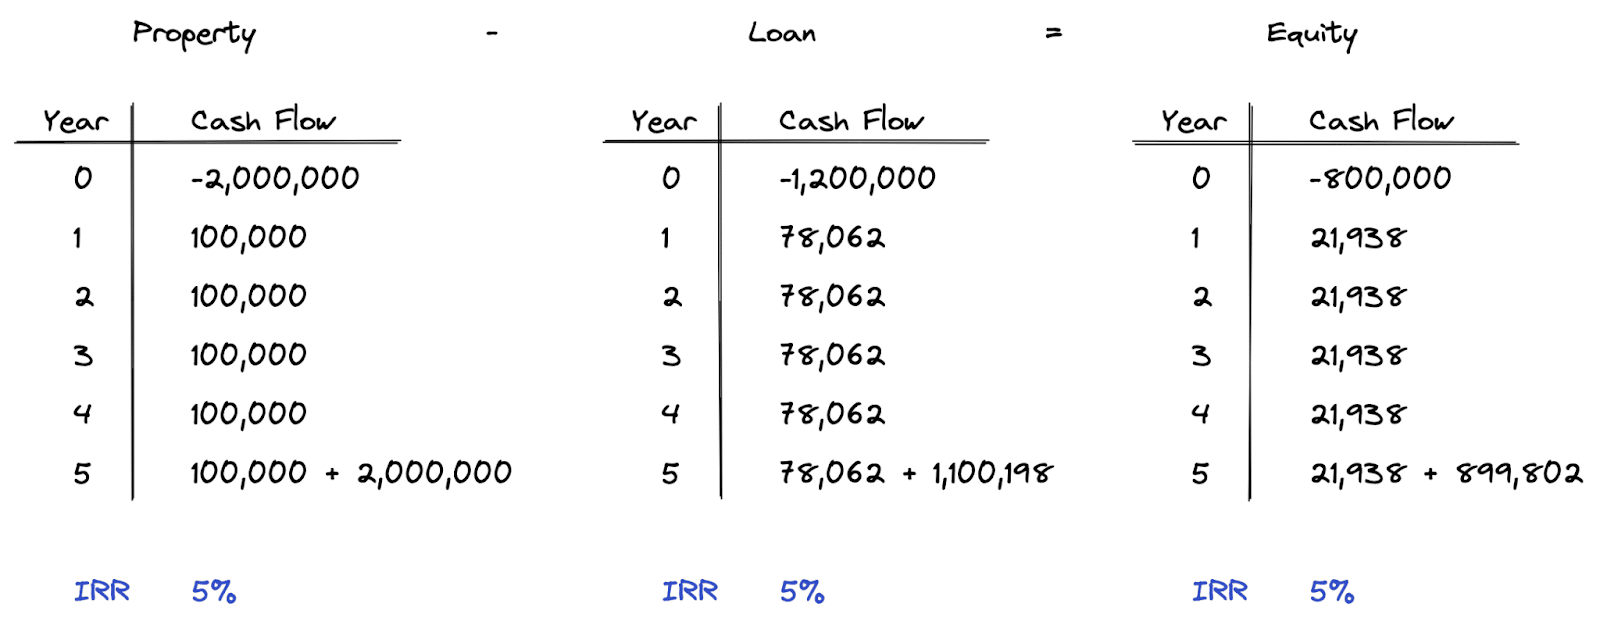
As you can see, the yield rate, or internal rate of return, is the same for the property, the loan, and the equity. The overall yield rate in this case is equal to the mortgage yield rate. That means we have neutral leverage. In other words, as we add more debt to this property under these loan terms, the equity yield will not change.
Notice how we have conflicting outcomes from the single year and multi-year analysis. In the single year analysis, we found negative leverage. However, in this multi-year analysis using the same cash flows and no growth or appreciation, we show neutral leverage.
The reason we get neutral leverage in the multi-year analysis is because we account for all the cash flows in the holding period, which includes the principal reduction of the loan at the end of year 5. This is the difference between using a single year metric like the cash on cash versus considering all the cash flows in the holding period using a multi-year discounted cash flow analysis. This doesn’t mean the single period analysis isn’t a good signal, but it is important to be aware of these differences.
Since we have neutral leverage, that means our equity yield will not change as we increase the loan to value. However, it will still increase the risk. Let’s take a look at why.
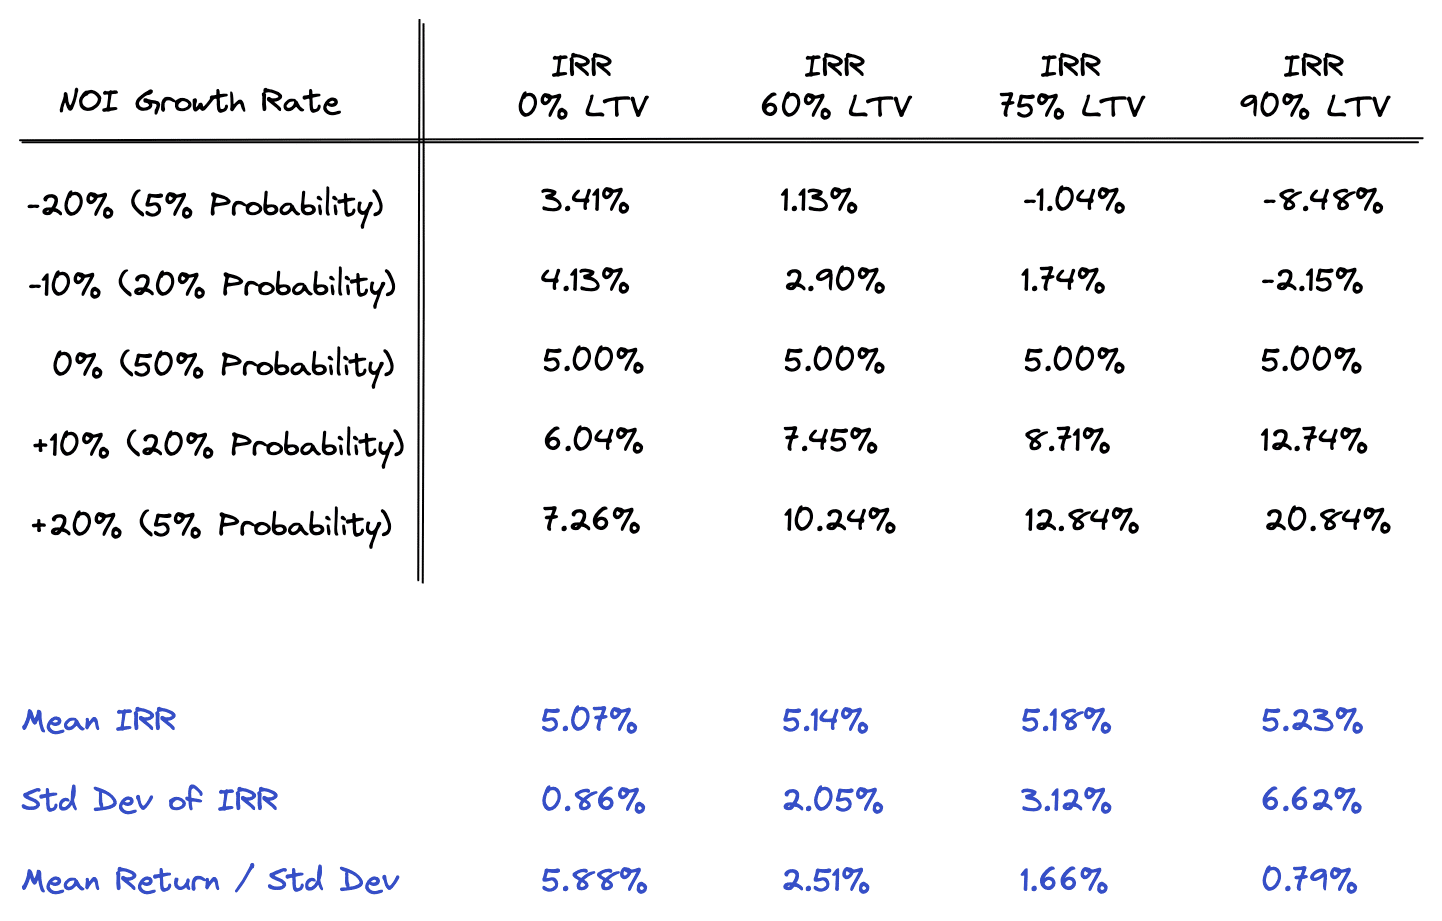
We are modeling five NOI growth scenarios, each under four LTV conditions. You can see how risk increases as leverage increases by looking at the range of returns under each LTV scenario. In the 0% LTV scenario, the IRR range is from 3.41% on the low end to 7.26% on the high end. In the 90% LTV scenario, the IRR range is -8.48% to 20.84%. This clearly shows how leverage magnifies both returns and losses.
This can also be seen by looking at the standard deviation, which measures the spread or dispersion of outcomes. A low standard deviation indicates that the data points tend to be close to the mean, while a high standard deviation indicates that the data points are spread out over a wider range. In our example, as the LTV increases, so does the standard deviation.
We can also see this by dividing the mean IRR by the standard deviation. This shows how much return we are getting per unit of risk. As illustrated above, the amount of return we get per unit of risk decreases as leverage increases.
Finally, notice how the 0% NOI growth scenario shows the same 5% IRR under all LTV conditions. This is because with 0% NOI growth, as illustrated earlier, we have neutral leverage. However, when NOI growth is negative (in the top two rows), then the IRR decreases as we use more leverage. That means we would have negative leverage in these scenarios. When NOI growth is positive (in the bottom two rows), IRR increases as we use more leverage, which means in these scenarios we would have positive leverage.
Keep in mind that in all of these scenarios, the NOI growth rates only apply to years 2-5 of the holding period. In other words, the first year NOI is the same 100,000 in all scenarios. That means a single year analysis in all scenarios would show negative leverage, but a multi-year analysis could show negative leverage, positive leverage, or neutral leverage. It all depends on the growth rate.
Weighted Average Cost of Capital and Leverage Analysis
Another way to see the relationship between these rates of return, and to analyze leverage, is to use the Weighted Average Cost of Capital (WACC) formula.
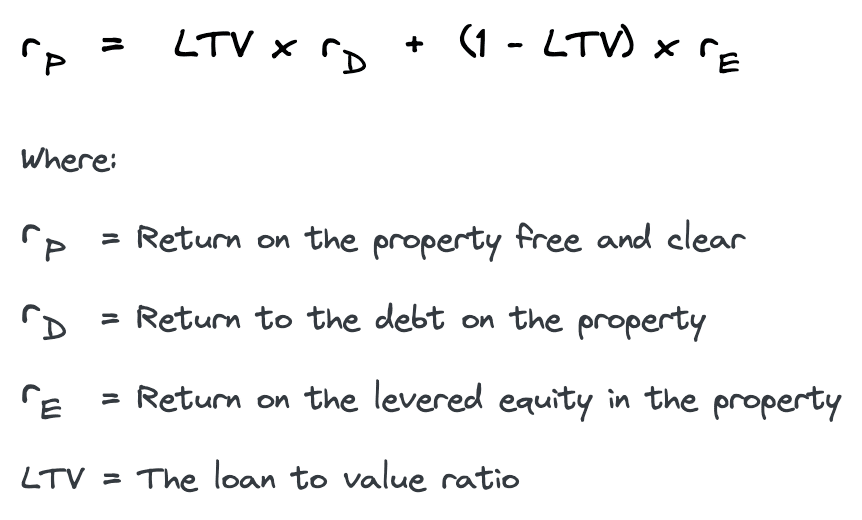
The WACC formula is derived from the fact that the property cash flow is equal to the debt cash flow plus the equity cash flow. That means if we know the LTV ratio and two out of three return components, then we can use the WACC formula to solve for the unknown return.
Let’s first discuss how to use the WACC formula with single year capitalization rates. Then we will discuss an issue you should be aware of when using the WACC formula with multi-year yield rates.
Single Year WACC
For example, let’s use the return on debt and return on equity in our previous single year example. Recall the calculated overall capitalization rate, mortgage capitalization rate, and equity capitalization rate in our single year example:
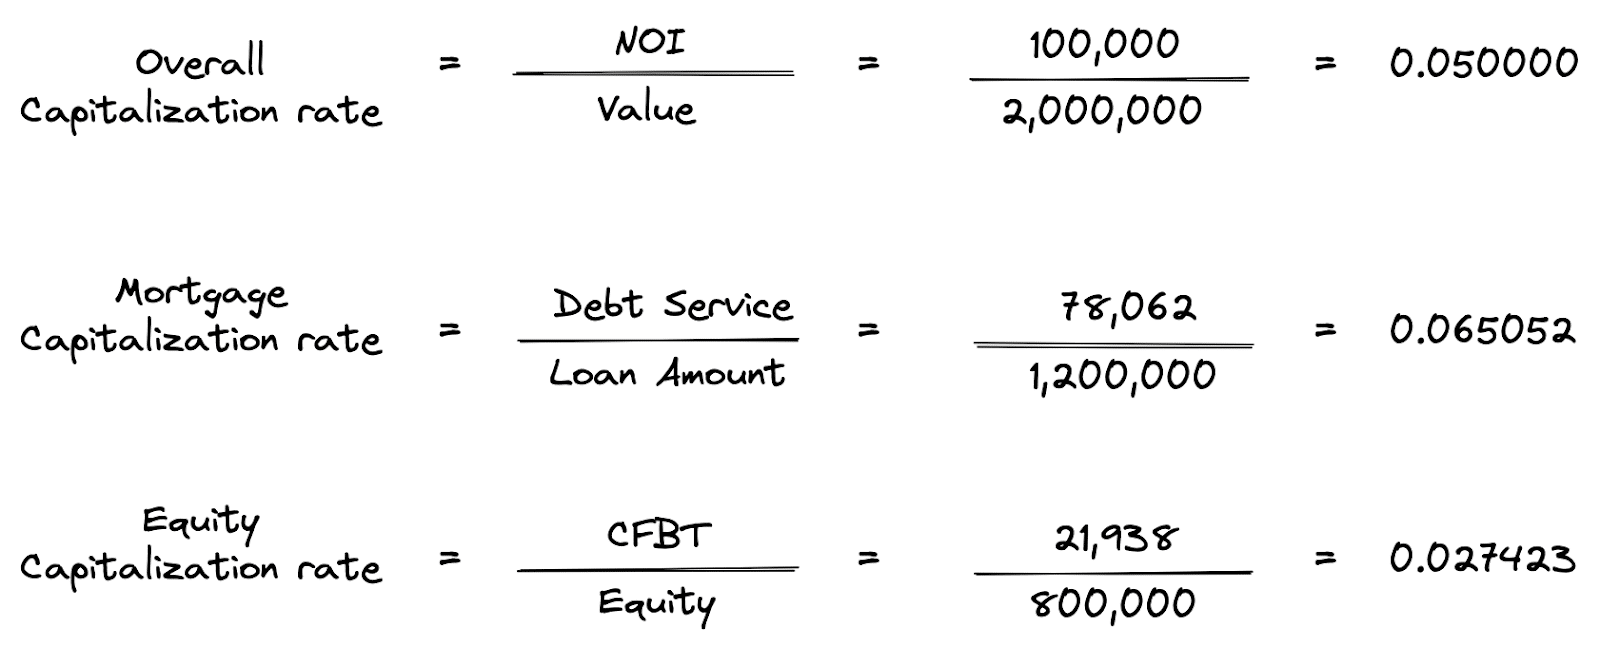
Suppose we only know the equity capitalization rate and the mortgage capitalization rate, and we want to solve for the overall capitalization rate. We can use the WACC formula to accomplish this task.
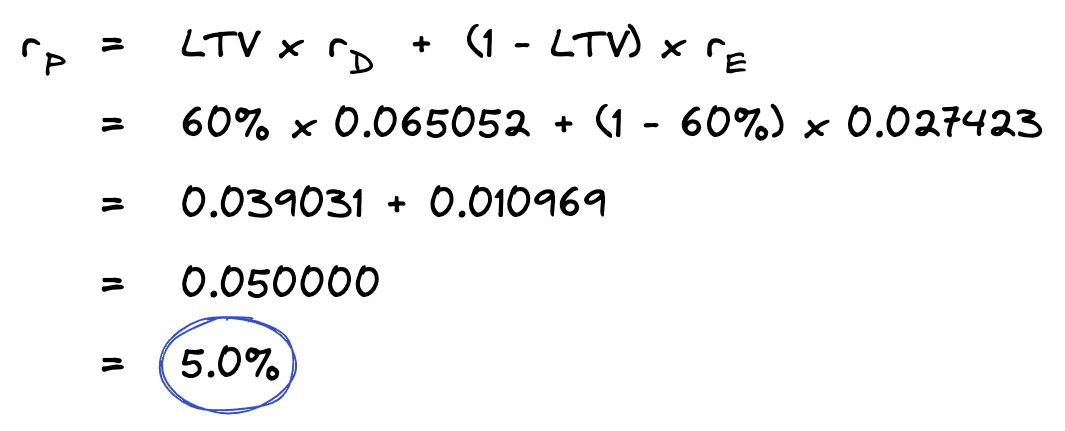
This lets us solve for the same overall capitalization rate we saw earlier in our single year analysis. Except this time all we needed was the loan to value ratio, the mortgage constant, and the cash on cash return.
In practice, this formula is often used to solve for the return on equity, since cap rates and loan terms are much easier to observe in the market. We can re-arrange the WAAC formula to solve for the return on equity like this:
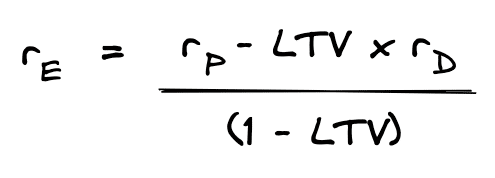
For example, if you know the LTV ratio, the property capitalization rate, and the mortgage constant, then you can quickly solve for the cash on cash return:
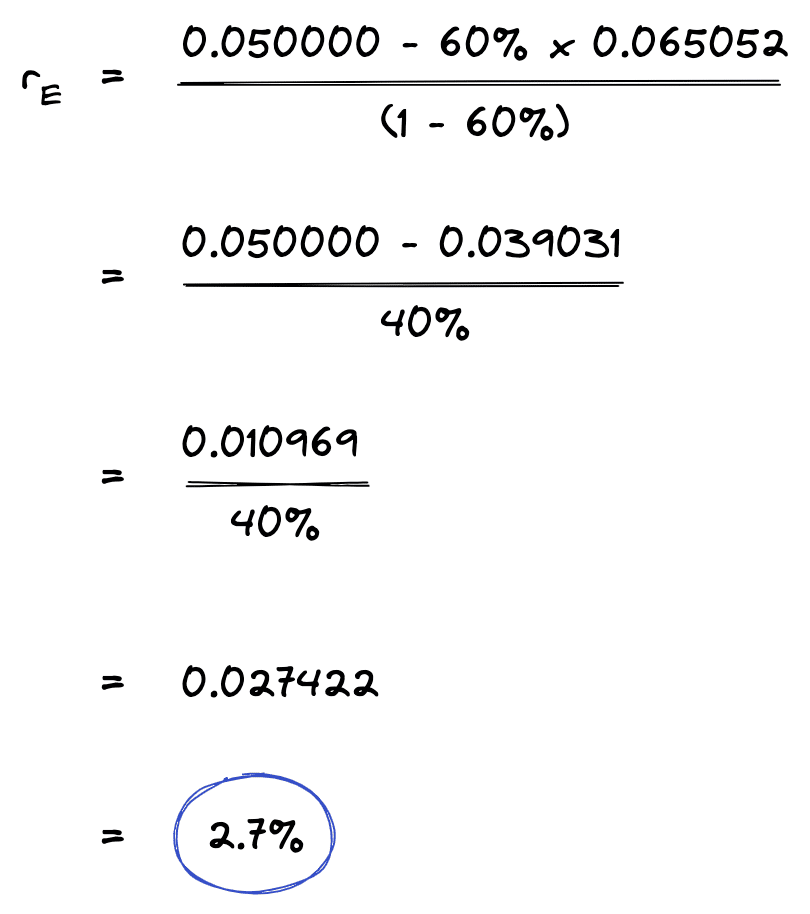
This WACC formula allows you to quickly solve for the cash on cash return on the back of an envelope basis, with limited information.
Multi-Year WACC
The WACC formula has an inherent error you should be aware of when using it in a multi-year analysis. The WACC formula is only accurate when all variables (LTV ratio and returns) remain constant. In a multi-year analysis, this is not always the case. Specifically, the loan to value ratio can change over the holding period as the loan balance declines.
Let’s take a look at a couple of examples to illustrate. First, recall our multi-year returns from our earlier example:

If we plug these returns into our WACC formula, we get the following.
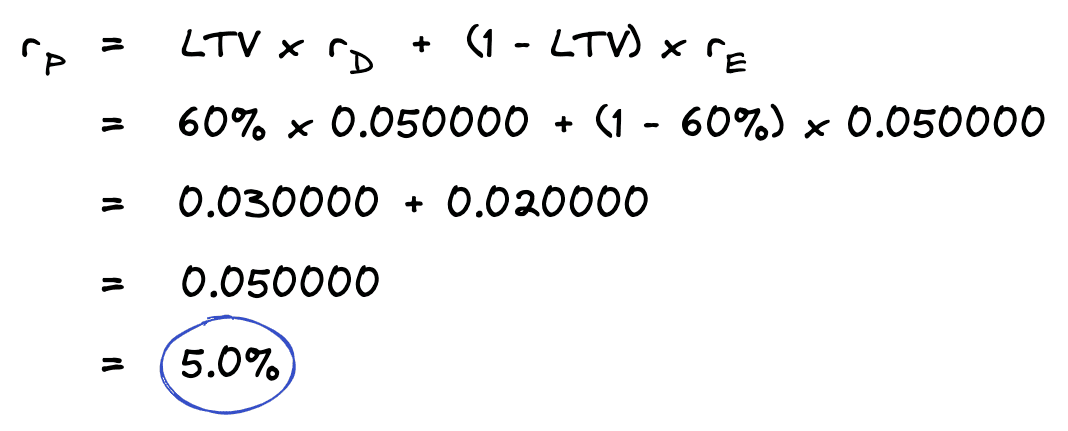
We end up with the correct result of 5%! But wait, I thought we said the WACC formula isn’t accurate when using multi-year returns? Notice that in this case, the equity yield and the debt yield are the same. When the happens, it doesn’t matter what the LTV is because the weighted average will also always be the same.
Now, let’s look at another example to illustrate the error. If we change the interest rate on the loan from the original 5% we used down to 4%, then we end up with the following cash flows and IRR calculations.
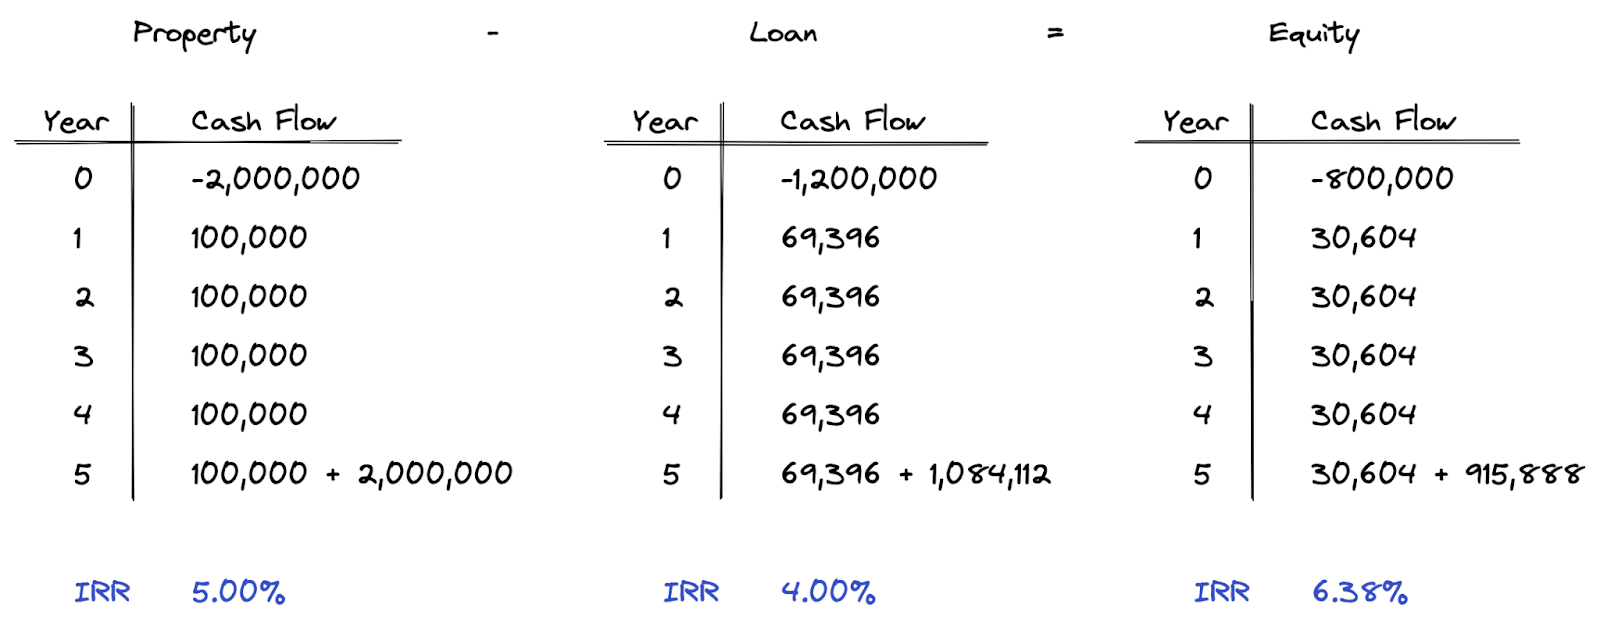
If we use these returns in a WACC formula, we end up with the following overall yield rate.
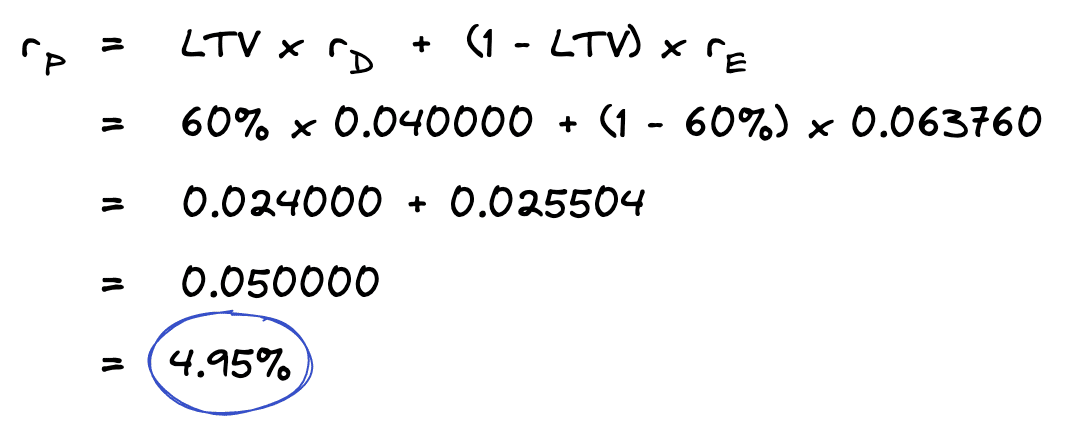
The overall yield rate in this case is 4.95%, which differs slightly from the actual yield of 5%.
You can also solve for the equity yield rate using the WACC formula. When you do this, you end up with 6.5% versus the actual 6.38% IRR we calculated on the cash flows above.
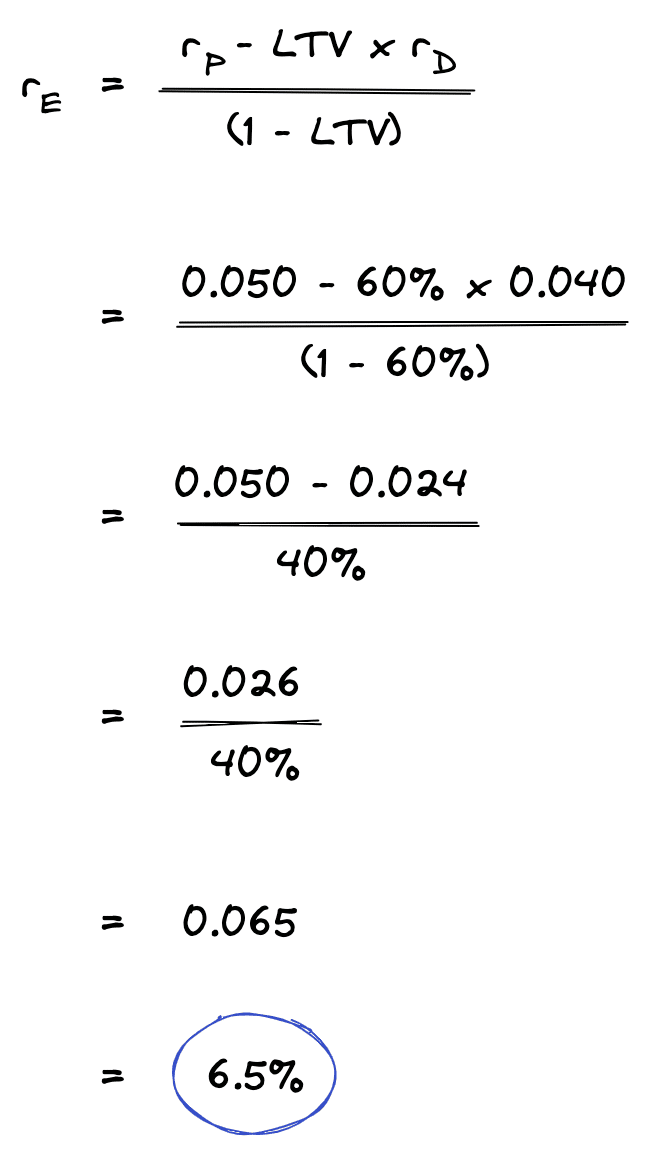
These examples illustrate how the WACC formula loses its exactness with multi-year returns. And it will be less exact over longer periods of time. This doesn’t mean the WACC formula can’t be a useful approximation when working with yield rates, but you should be aware of its limitations.
Conclusion
In this article, we discussed negative leverage, positive leverage, and neutral leverage. We defined these terms using single year capitalization rates, and also using multi-year yield rates. After reviewing single year and multi-year example calculations, we then discussed how you can use the weighted average cost of capital formula to analyze leverage with limited information.
