The equity multiple is a commonly used performance metric in commercial real estate, and yet it’s not widely understood. In this article, we’ll take a look at the equity multiple as it’s used in commercial real estate, and we’ll also walk through several examples step-by-step.
What Is the Equity Multiple?
First, what exactly is the equity multiple? In commercial real estate, the equity multiple is defined as the total cash distributions received from an investment, divided by the total equity invested. Here is the equity multiple formula:

For example, if the total equity invested into a project was $1,000,000 and all cash distributions received from the project totaled $2,500,000, then the equity multiple would be $2,500,000 / $1,000,000, or 2.50x.
At the deal level in commercial real estate, the numerator of the equity multiple usually refers to before tax cash flow plus net sale proceeds after debt payoff and costs. The denominator is the total equity invested. However, sometimes the numerator may be calculated differently, so it’s always best to confirm definitions to avoid confusion.
At the fund level, the equity multiple is typically calculated as total fund distributions divided by total fund equity contributions. In private markets, the term MOIC (multiple on invested capital) is often used interchangeably with equity multiple. Investors often distinguish between gross equity multiple (before fees and carry) and net equity multiple (after management fees and carried interest). While the math is the same as at the deal level, timing differences and cross-subsidies between deals can make fund-level multiples less informative on their own, which is why investors usually review IRR alongside them.
What does the equity multiple mean? An equity multiple less than 1.0x means you are getting back less cash than you invested. An equity multiple greater than 1.0x means you are getting back more cash than you invested. In our example above, an equity multiple of 2.50x simply means that for every $1 invested into the project, an investor is expected to get back $2.50 (including the initial $1 investment).
What’s a good equity multiple? As always, this depends. Context is required to determine what a “good” equity multiple means. Typically, the equity multiple is most relevant when compared with other similar investments.
Equity Multiple Proforma Example
Let’s take a look at an example of how to use the equity multiple in a commercial real estate analysis. Suppose we have an acquisition that requires $4,300,000 in equity, and we expect the following proforma cash flows:
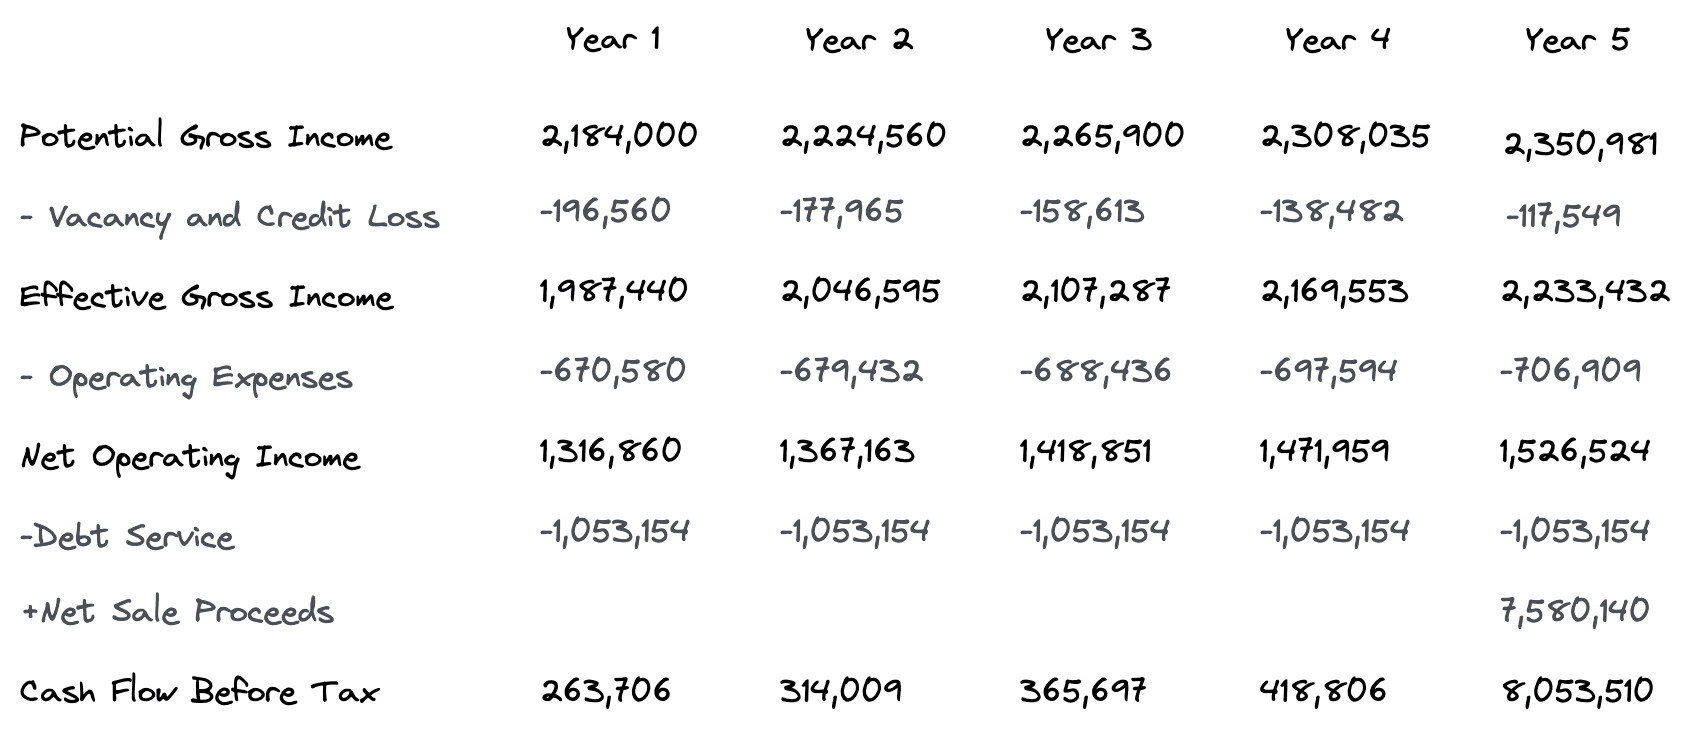
If we add up all the before tax cash flows in the proforma above, then we’ll end up with total distributions of $9,415,728. This results in a calculated equity multiple of $9,415,728/$4,300,000, or 2.19x.
What does a 2.19x equity multiple mean? This simply means that for every $1 invested into this project, an investor is expected to get back $2.19 (including the initial $1 investment).
Is 2.19x a good equity multiple? As mentioned earlier, the fact that it’s higher than 1.0x means the investor is getting back more money than initially invested. However, the equity multiple alone doesn’t say anything about the timing because the equity multiple ignores the time value of money. In other words, a 2.19x equity multiple is much better if the holding period is 1 year versus 100 years. This is why the equity multiple is most relevant when compared to equity multiples of other similar investments.
Strengths and Limitations of the Equity Multiple
The equity multiple is simple and intuitive. Investors can immediately see how much cash they are projected to receive relative to what they invested. It has several strengths:
- Clarity. Easy for both sophisticated and first-time investors to interpret.
- Total-return focus. Captures the sum of all distributions, including operating cash flows and sale proceeds.
- Comparability. Helpful for sizing up similar deals or funds side by side.
But it also has important limitations:
- Ignores timing. A 2.0x multiple over 3 years is very different from a 2.0x multiple over 10 years.
- Not a risk measure. High multiples may simply reflect high leverage or back-loaded assumptions.
- Return of vs. return on capital. The metric doesn’t distinguish how much is just your capital being returned.
- Not annualized. Unlike IRR, it doesn’t tell you the rate of return per year.
Because of these limitations, equity multiple is best used as a complementary metric alongside IRR, XIRR, NPV, and cash on cash return, rather than on its own.
Equity Multiple vs IRR
What’s the difference between the equity multiple and the internal rate of return? This is a common question since the equity multiple is often reported along with the IRR.
The major difference between the IRR and the equity multiple is that they measure two different things. The IRR measures the percentage rate earned on each dollar invested for each period it is invested. The equity multiple measures how much cash an investor will get back from a deal. The reason why these two indicators are often reported together is because they complement each other. The IRR considers the time value of money, while the equity multiple does not. On the other hand, the equity multiple describes the total cash an investment will return, while the IRR does not. Let’s take a look at an example of how these two measures can be used together.
The equity multiple is a performance metric that helps put the IRR into perspective by sizing up the return in absolute terms. The equity multiple does this by describing how much cash an investment will return over the entire holding period. Suppose we have two potential investments with the following cash flows:
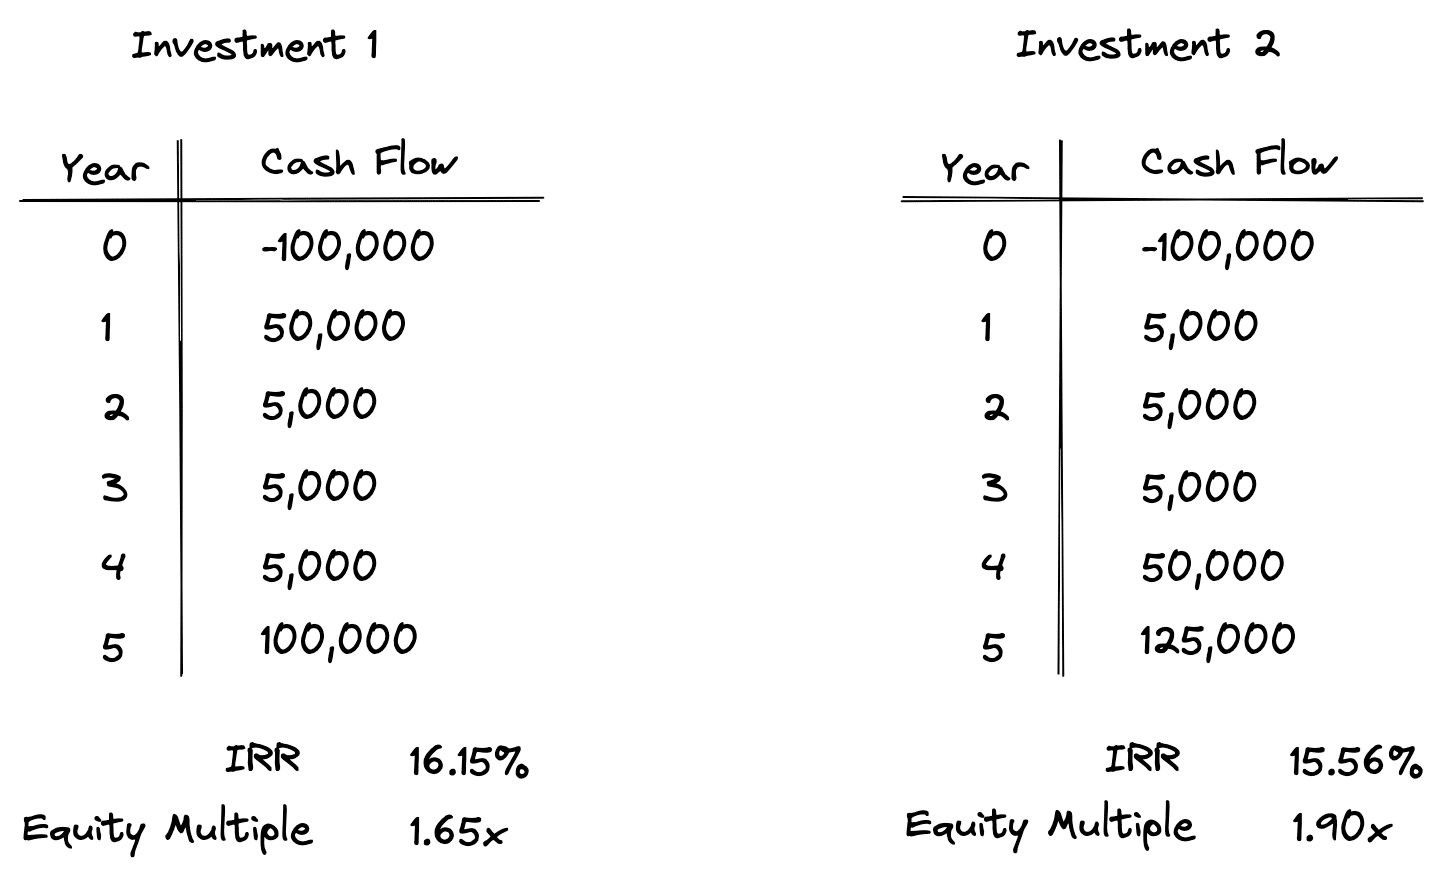
As you can see, the first investment produces a 16.15% IRR, while the second investment only produces a 15.56% IRR. If we were using the IRR alone, then the choice would clearly be the first set of cash flows. However, the IRR isn’t a silver bullet and doesn’t always tell the full story. This can be seen by looking at the equity multiple for both investment options. Although the second investment has a lower IRR, it has a higher equity multiple. This means that despite a lower IRR, investment #2 returns more cash to the investor over the same holding period.
Of course, there are other factors to consider. For example, Investment #1 returns $50,000 at the end of year 1, whereas with Investment #2, you have to wait for 4 years to get $50,000 of cash flow. Depending on the context of these deals, this may or may not be acceptable.
For example, if you intend to put all the cash flow from Investment #1 into a checking account earning next to nothing, then perhaps Investment #2 would make more sense since your cash will be invested longer. On the other hand, perhaps the cash flows from Investment #2 are more uncertain, and you’d prefer the peace of mind that comes with getting half of your investment back in Year 1 with Investment #1.
These are issues that would be addressed in a full investment underwriting, and there are also several other metrics and qualitative factors that could be considered. With that said, the equity multiple allows you to quickly understand how much cash a project will return to the investors, relative to the initial investment. It also adds some additional context to the IRR when looking at a set of cash flows to help you quickly size up an investment’s absolute return potential.
Industry Usage and Benchmarks
What counts as a “good” equity multiple depends on the investment strategy, the holding period, and the broader market cycle. Still, some broad patterns are often referenced in the industry:
- Core / core-plus properties (lower risk, longer hold periods): Equity multiples often fall in the 1.3x–1.6x range over a 7–10 year horizon. These investments prioritize stability and income, so multiples are lower but more predictable.
- Value-add or opportunistic deals (higher risk, shorter hold periods): Sponsors commonly target 1.7x–2.0x+ over 4–7 years, reflecting both higher risk and active repositioning strategies.
- Private equity real estate funds: At the portfolio level, equity multiples are usually presented both gross (before fees and carry) and net (after fees and carry). Investors often look for net 1.5x–2.0x multiples over a full fund life, though this varies by vintage and cycle.
- Open-end core funds: Equity multiple is less commonly emphasized because each investor has unique subscription and redemption dates. Instead, performance is benchmarked against time-weighted indices such as the NFI-ODCE. In this context, EM can be misleading since it depends on the individual investor’s cash-flow path.
Because equity multiple does not account for timing or risk, it should never be judged in isolation. Its real value comes from comparing similar opportunities side by side, and from pairing it with IRR and qualitative assessments of risk.
These ranges should be viewed as anchors rather than absolutes. Multiples vary significantly with hold period, leverage, market conditions, and underwriting assumptions. Sponsors may also market aggressive targets, while realized outcomes are often lower. Equity multiple benchmarks are best used as reference points to frame expectations, not as rigid thresholds of performance.
Conclusion
The equity multiple is one of the most widely used performance metrics in commercial real estate. It is straightforward to calculate, easy to interpret, and provides a quick sense of how much total cash an investment is expected to return relative to the initial equity invested. We defined the equity multiple at both the deal and fund level, highlighted its relationship to MOIC, and noted the distinction between gross and net multiples.
Through a step-by-step example, we saw how to calculate the equity multiple and interpret its meaning. We also discussed its strengths, such as clarity, comparability, and total-return focus, along with its limitations, including the fact that it ignores timing, risk, and annualization. To put the equity multiple into context, we compared it with IRR, which accounts for the time value of money, showing why the two are often reported together.
Finally, we looked at how practitioners use equity multiple benchmarks in the industry. While sponsors often target ranges such as 1.3x to 1.6x for core properties and 1.7x to 2.0x or higher for value-add and opportunistic deals, these ranges should be treated as anchors, not absolutes. Market cycles, leverage, hold periods, and underwriting assumptions all influence realized outcomes.
In the end, the equity multiple is most useful when paired with other metrics like IRR, NPV, and cash-on-cash return, and when evaluated in the broader context of risk, timing, and strategy. Used this way, it can add real insight into the absolute return potential of a commercial real estate investment.
Want to calculate your own equity multiples and IRRs? Try our PMX Proforma App to quickly build detailed DCF models, run scenario analysis, and see how your deals perform across different assumptions, all in one place.