Suppose that a medium sized accounting firm is looking to expand its footprint by leasing office space in a new city. After touring several spaces, they have narrowed it down to two options. The options have similar rental rates, but the firm wants to conserve capital so they need to figure out which one is less expensive.
To solve this problem, they need to identify and analyze all of the cash flows from each lease and discount them back to the present time. This process is known as comparative lease analysis and it is the subject of this article.
How to Perform Comparative Lease Analysis
At its core, the process of comparing two or more leases is an exercise in identifying the detailed costs (cash outflows) associated with each, when they occur, and how much they are. Once these pieces of information are obtained, they need to be “discounted” back to the present time to account for the time value of money.
The time value of money is a concept that states a dollar today is worth more than a dollar in the future due to its ability to be reinvested and earn interest. Because lease cash flows occur in the future, they need to be “discounted” back to the current time to determine their “present” value.
From the present value, the “net effective rent” can be calculated, which is the total gross rent divided by the number of month periods in the lease. This figure accounts for rental concessions or free rent so it is an accurate gauge of the true cost of the lease.
So, the comparative lease analysis can be boiled down to two steps:
- Identify all of the cash flows associated with lease payments, then calculate the net present value using a discount rate and a financial calculator or spreadsheet program like Excel.
- Calculate the Effective Rent by converting the net present value to an equivalent level annuity.
Once these steps are complete, the output will provide an objective view of the cost associated with each lease and allow the analyst to determine which one is less expensive. While these steps may seem simple in theory, they can be slightly more complex when applied to a real world scenario. To illustrate how comparative lease analysis works, we will review two examples, a simple one and a more complex one.
Simple Comparative Lease Analysis Example
Assume that a company is trying to decide between two leases for 10,000 square commercial property. Each of the lease terms is for three years and does not include any free rent or extra payment for operating expenses.
Lease A has a base rent of $20 per square foot with an escalation of $1 per year. As a result, the rental amounts for the entire term are $20, $21, and $22 per square foot.
Lease B has a base rental rate of $19 per square foot with an escalation of $1.50 per year. As a result, the rental amounts for the entire term are $19, $20.50, and $22 per square foot.
To calculate the net present value, assume that the discount rate is 10%. The following table provides a summary of the calculation:
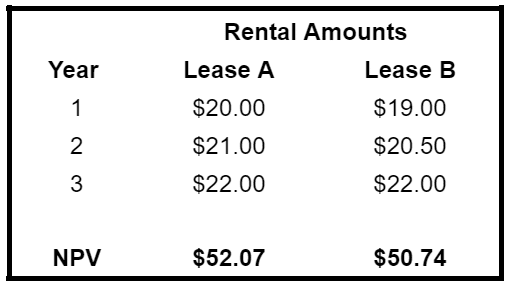
From the lease comparison table, it can be seen that the net present value (NPV) for lease A is $52.07 while the NPV for lease B is $50.74. This completes step 1 of the effective rent calculation.
Next, these values are used as inputs in the conversion to an equivalent level annuity. To do this, the “PMT” spreadsheet function can be used with the following variables:
- Rate: 10.00%
- Number of Periods: 3
- Future Value: $0
- Present Value: NPV of lease payments
Note that we are using a discount rate of 10% and in practice this is typically your opportunity cost or cost of capital. The following table summarizes these values for lease A and lease B:
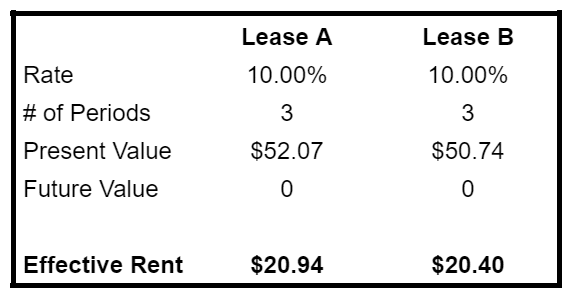
The result of the calculation is that lease A has an effective rent of $20.94 while lease B has an effective rent of $20.40. From this output, real estate professionals could reasonably conclude that lease B is the less expensive option.
The example above provides a good introduction to the effective rent calculation, but it is overly simplistic. In reality, commercial real estate lease terms are not this straight forward. There are other variables that commonly go into the financial analysis like tenant improvement and expense reimbursements. To account for the impact of these, let’s go through a slightly more complicated example.
Advanced Comparative Lease Analysis Example
In this example, we will explore two more complicated lease types, but perform the same basic analysis. The proposed lease is for 3,000 square feet.
Lease Option 1
In the first option, the rental pricing parameters are as follows:
- Base Rent: $20 PSF, increasing 3% annually
- Operating Expenses: $5 PSF, increasing 4% annually
- Parking Fees: $1.50 PSF
- Moving Expenses: $4,000
- Required Tenant Improvements: $15,000
- Tenant Improvement Allowance: $10,000
- Lease Term: 3 Years
With these additional variables, the lease analysis becomes more complicated because they all have to be accounted for in a model of the cash flows. We prefer to use a template for this purpose. By inputting the above information, the following cash flows are projected:
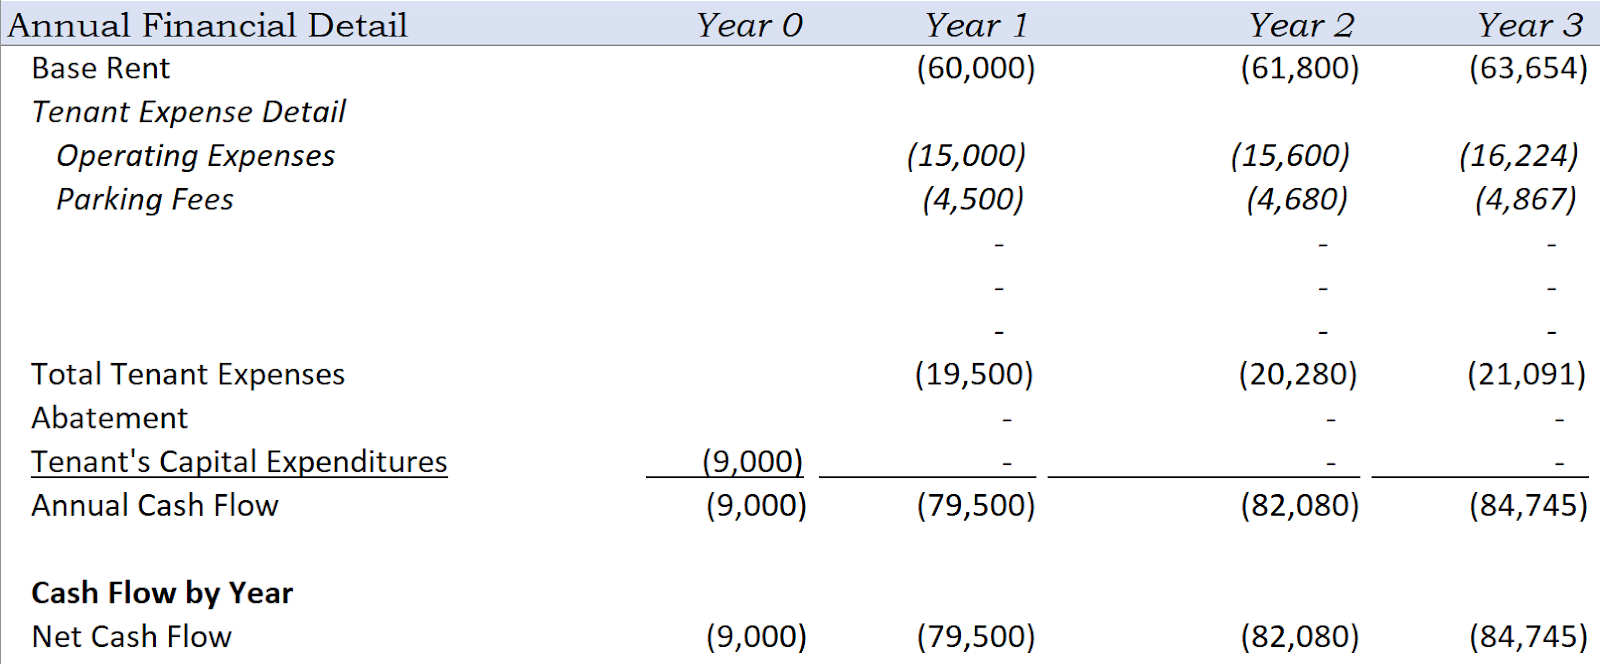
In year 0 of the model, the capital expenditure line item represents the initial out of pocket costs for getting into the lease. Tenant improvements of $15k are netted against the allowance of $10k and added to the moving costs of $4k. The total year 0 costs are $9,000 or $3 per square foot.
Starting in year 1, base rent is $60,000 ($20 PSF, per year) and the operating costs are $19,500, which represents a sum of the reimbursable operating expenses and parking fees.
When the costs are added to the base rent, the total year one outflow is $79,500. This increases each year based on the modeled rent and expense increases.
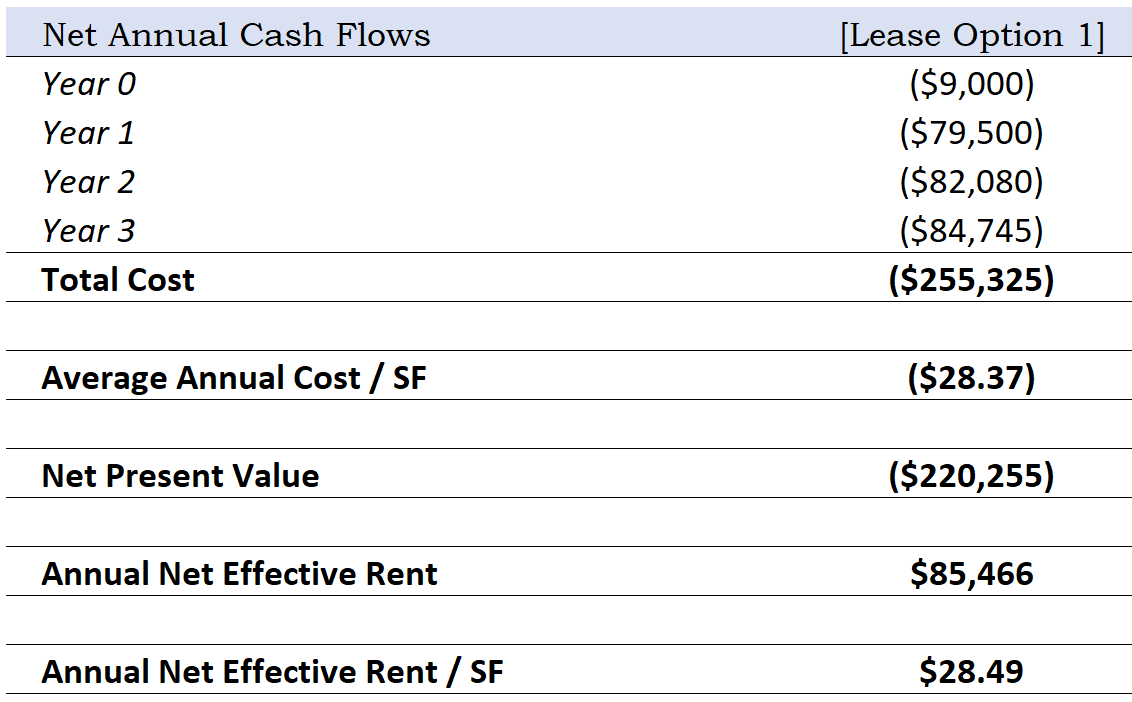
The net result of this analysis produces the cash flows shown in the following table. When discounted at a rate of 8%, the Net Present Value and Annual Net Effective Rent metrics can be calculated. A summary is shown in the table below.
Let’s see how this result compares to lease option 2.
Lease Option 2
The second option is a different lease all together. The parameters are:
- Base Rent: $19 PSF, increasing $.50 cents per year
- Operating Expenses: $6 PSF, increasing 4% annually
- Moving Expenses: $6,000
- Required Tenant Improvements: $17,500
- Tenant Improvement Allowance: $12,000
- Lease Term: 3 Years
When these parameters are put into the analysis template, the result is summarized in the table below:
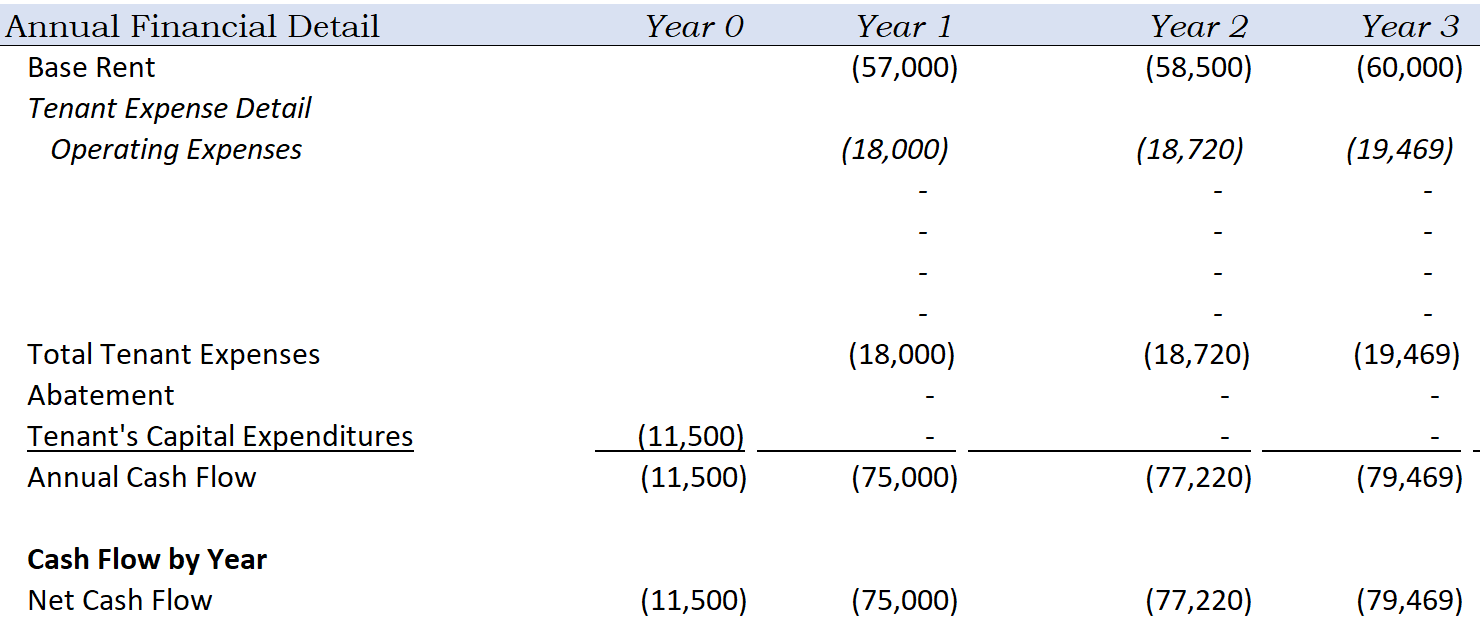
Year 0 cash outflow is $11,500, which represents the net tenant improvement cost plus moving expenses.
Year 1 cash outflow is $75,000, which represents the base rental cost plus total tenant expenses. This increases each year based on the percentage increases.
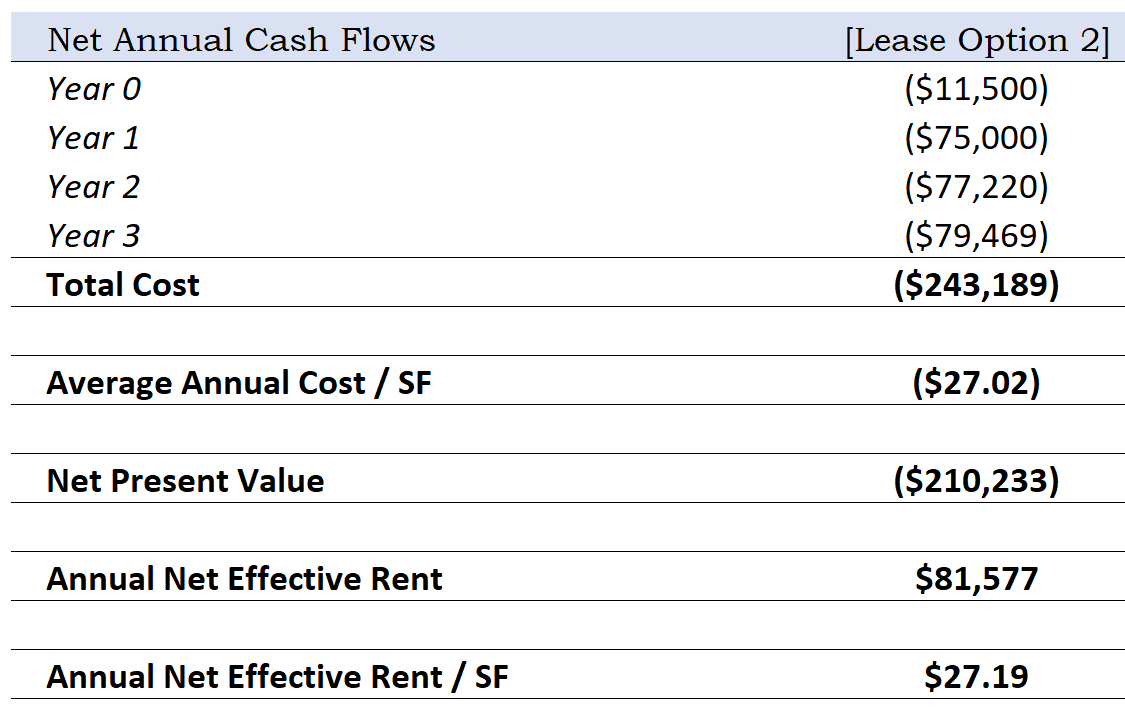
The cash flows are summarized in the table below where the Net Present Value and Net Effective Rent are calculated:
With this information, it is now possible to compare the two leases side by side to see which is less expensive for the tenant.
Lease Comparison Summary
The following table shows both sets of cash flows side by side:
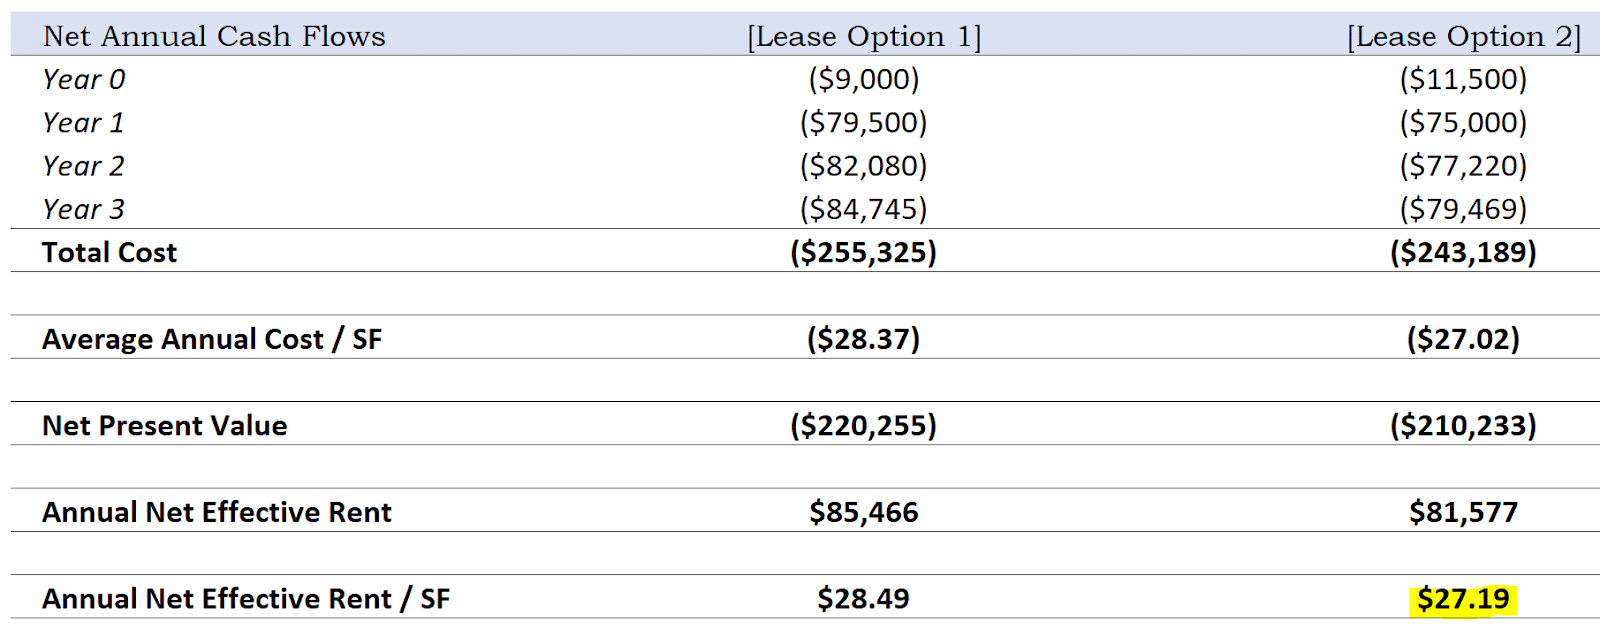
From this result, it can be seen that lease 2 has the lower total cost, Net Present Value, and Annual Net Effective Rent. For this reason, it can be safely concluded that it is the less expensive option. But, this doesn’t necessarily make it the better option. There may be other, non-financial considerations that could cause the tenant to choose the more expensive option. Perhaps it has a better location, interior functionality, covered parking, nicer finishes, or it is next to a train stop.
The broader point is, comparative lease analysis is useful for determining the financial cost associated with two or more options. However, the cost is only one piece of the puzzle. There are other intangible factors that a tenant may consider that could cause them to choose the more expensive option. It does, however, provide an excellent starting point for comparison and should be completed whenever comparing two or more lease options.