A commercial real estate developer identifies a property ideal for its use, but because he can’t find a way to make the project financially feasible, he considers looking elsewhere. The city though wants the developer to undertake the project because it would replace property that generates negative social and economic impacts with a property that offers positive ones. What is a possible solution?
Tax increment financing, or “TIF.”
What is Tax Increment Financing (TIF)?
In its simplest terms, TIF:
(1) redirects the incremental increase in certain tax revenues generated by a redeveloped property from taxing districts to the redeveloper
(2) to cover a portion of the project’s costs
(3) in order to make the project financially feasible.
It is the marriage of private (the developer’s) and public (the taxing districts’) monies to facilitate a project that will benefit both private and public, where the project would not otherwise happen.
TIF revenue is only created if the proposed project will generate an increase in tax revenue over that generated by the existing use (or non-use). For example, where a retail center has lost tenants, whether because of changing demographics, moves to newer centers, or other reasons, the tax revenue generated from this property decreases. A fall in rental income reduces the owner’s ability to maintain and repair the property, its real property value goes down, and real property taxes fall. Likewise, the loss of tenants reduces sales and the consequent sales taxes. Further, fewer tenants results in less taxable personal property and personal property taxes.
When a project will rehabilitate the center (or demolish it and construct a new one) and locate new tenants, real and personal property value, sales, and the related tax revenue, all increase. The difference between the increased taxes resulting from the redevelopment and the taxes generated by the existing property is the “increment” potentially available to incent and facilitate the redevelopment.
How Do Cities and Developers Determine if TIF is Appropriate for a Project?
TIF redirects tax revenue from taxing districts to the redeveloper. Accordingly, as part of a city’s determination as to whether the use of TIF is appropriate, it will consider whether the amount redirected is necessary for the project to move forward, and whether the project benefits outweigh the potential impact to taxing districts. This consideration is accomplished through different financial analyses. This article outlines common analyses, and how to decipher them.
It should be noted that while TIF projects generally create benefits other than just increased tax revenue (e.g., new jobs, elimination of blighting conditions such as crime, impairing potential redevelopment of surrounding properties, etc.), this article examines only the financial analyses.
The statutes governing TIF vary by state. Accordingly, this article uses the general framework of TIF within the State of Missouri, and the analyses often considered by local governing bodies and taxing districts within the State. The principles outlined however are applicable to many other jurisdictions.
The three analyses considered here are (1) TIF revenue projections, (2) tax revenues to the taxing districts with the project and the use of TIF compared to revenues with no project (Tax Impact Analysis), and (3) an analysis to determine if the amount of TIF requested is necessary to make the project financially feasible (this can be referred to as part of a “but for” requirement, i.e., that “but for” the use of TIF, the project would not occur).
TIF Revenue Projections
From the developer’s perspective, the determination of how much TIF revenue is available to offset project costs is paramount. It determines, when coupled with the developer’s private monies, the expected return on its investment. Which incremental tax revenues can be redirected most commonly involve real property taxes. Some jurisdictions also permit TIF to capture taxes from increases to activity with the project, such as sales tax. Other activity taxes may also include an incremental increase to individual and corporate income taxes where the local jurisdiction has imposed them.
The starting point for all projections are the assumptions. Below are typical assumptions pages for real property, sales, and personal property. Although personal property is not captured by TIF in Missouri, because the tax revenues created by new property impacts the taxing districts, its assumptions are included.
Real Property Tax Revenue Assumptions
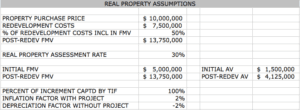
In order to determine the incremental increase to real property tax revenue, the developer estimates the fair market value (FMV) of the project when completed, and compares it to the FMV of the current property. The FMV is the estimated price that a buyer would pay to a seller for property in the current marketplace, provided both parties are knowledgeable, willing and not under duress. In this case, the projected FMV is calculated by adding to the purchase price 50% of the redevelopment costs ($10,000,000 + (50% x $7,500,000) = $13,750,000). Simplified valuations like this are not uncommon, though cities and developers may use other agreed upon methods, such as the three appraisal approaches to value (i.e., cost, income and comparable sales).
The existing property’s FMV is taken from the tax rolls ($5,000,000). The governing body and taxing districts may challenge such calculations, or require an appraiser to determine projected and existing FMVs. Of course, all the assumptions noted in these analyses can be a point of contention between the public and private parties.
The FMVs are then converted into assessed values (AV). Assessed value is a property’s dollar value, determined by the local government, which is used to calculate real property taxes. Generally the assessed value is determined by taking the FMV and multiplying it by an assessment rate. These rates may differ by land use (e.g., assessment rates could be 15% of FMV for industrial property, and 10% of FMV for agricultural uses).
Real property values are not static over time, and TIF is captured for a period of years. Accordingly, TIF revenue projections will include inflation factors rates for the new project (2%) and depreciation factors if the new project does not occur (-2%). Guidance on all real and personal property valuation assumptions, including inflation and depreciation factors, is often sought from the local tax assessment department, which will determine valuations for tax purposes.
Lastly, the above assumptions note that 100% of the real property increment will be redirected to offset project costs (“captured” by TIF). Because only the incremental increase is captured, the taxing districts will continue to receive the real property taxes generated by the property’s current use through the term of the TIF.
Sales Tax Revenue Assumptions
As with real property, the sales tax revenue projections must establish starting points for existing and post-redevelopment sales. The above assumptions provide that current sales are $500,000, and the projected sales in Year 1 of the redeveloped project will be $3,000,000. New sales are further projected to grow at an annual rate of 3%. Often construction and tenancy will occur in stages. In such cases, more detailed assumptions will show phased-in sales, and then a fixed growth rate upon completion of the phases.
Because the analysis relating to the impact of the project on taxing districts will compare district revenue with the project and TIF vs. no project, the assumptions estimate that if no redevelopment occurs, sales will decrease by 3% every year. A decrease in sales in a blighted property is often supported through sales tax data for the declining property, and the assumption that this decline will continue absent redevelopment.
In the above, the starting increment is projected at Year 1 new sales of $3,000,000 less existing sales of $500,000 = $2,500,000.
The assumptions further note that only 50% of the incremental increase to sales tax revenue (as opposed to 100% of real property taxes) will be captured by TIF.
Personal Property Tax Revenue Assumptions
As with the real property assumptions, FMVs are determined for the existing personal property (Initial FMV $100,000) and completed project ($2,000,000), and then multiplied by the assessment rate for personal property (35%).
These projections assume that all personal property, whether redevelopment occurs or not, will annually depreciate at a rate of 10%. Depending on the new project use, however, this assumption will vary. For example, technology companies may frequently update equipment to keep pace with the industry, meaning that because depreciated personal property is regularly replaced with new property, there is no projected decrease in value (and in some cases, there may even be an increase).
Lastly, these projections state that no part of the personal property increment will be captured by TIF. The taxing districts will retain all revenue.
Taxing District Levy Rates
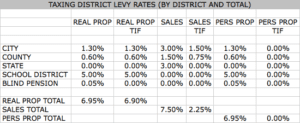
The above detail of taxing district levies stresses the importance of understanding not only which types of tax revenue the districts receive, but also whether under the applicable state law those revenues are subject to TIF capture. For this example five districts were used to illustrate four different revenue treatments.
The City and County can levy real property, personal property and sales, but its personal property taxes are not subject to TIF. The State can levy only sales taxes, but they are not subject to TIF. The School District can levy only real and personal property, and only the real property taxes are subject to TIF. And, lastly, while the Blind Pension District can levy real and personal property, none of its tax revenue is subject to TIF. Understanding how state law treats taxing districts differently is vital to projecting a redevelopment’s potential TIF revenue, and the impact of the project on all districts.
TIF Revenue Projections – Real Property Increment
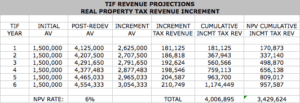
TIF revenue is captured over a period of years. In Missouri it can be redirected for up to 23 years. For space reasons, this example runs for six. The first two columns pull the existing AV and projected AV of the real property from the assumptions page. The initial value remains constant through the TIF term, and the taxing districts will continue to receive tax revenue based on this assessed value. As the projected property value grows at the assumed rated, the incremental AV grows too. The incremental real property tax revenue is simply the incremental AV multiplied by the total levy rate. In Year 1: $2,625,000 x 6.9% = $181,125.
The annual real property increment is then totaled for the TIF’s term. Many analyses will determine the net present value (NPV) of the TIF revenue stream, as developers may borrow funds secured, in part, by such revenue. In the example, the total gross projected revenue over six years is $4,006,895, and the NPV is $3,429,624.
TIF Revenue Projections – Sales Increment
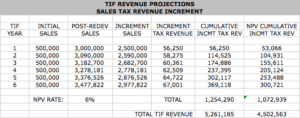
The calculation of incremental sales tax revenue is similar, though it must account for, in the case of this example, the limitation that only 50% of the sales tax increment is captured. The initial (existing) sales are shown in the first column, and remain fixed through the term. Taxing districts will receive all tax revenue calculated on this base. The estimated sales increase annually at the assumed growth rate (3%), resulting in a growing sales increment. The revenue calculation is then the total sales levy subject to TIF capture x incremental sales x 50% (in Year 1: 2.25% x $2,500,00 x 50% = $56,250).
The table then reflects the gross and NPV incremental sales tax revenues available to offset project costs. Adding the real property and sales tax increments estimates the total available TIF funds (gross $5,261,185, NPV $4,502,563).
These revenues will be used in the “but for” analysis to determine if the redevelopment, with the assistance of TIF, is projected to generate an acceptable IRR. Additionally, some municipalities may cap TIF revenue at a certain percentage of total project cost. In this example, total TIF revenue divided by total project costs (TIF $5,261,185 / (purchase price $10,000,000 + redevelopment costs $7,500,000)) means that TIF is available to fund 30% of the project. In all cases, however, TIF revenues must exceed the costs the developer is asking be reimbursed by TIF.
Tax Impact Analysis
The purpose of the tax impact analysis is to quantify the projected impact of a TIF project on all affected taxing districts. This requires looking at each type of tax for each district, with and without the project. It should be noted that this type of analysis does not consider the scenario where redevelopment occurs without TIF, as the presumption is that the developer, and all other developers, would not take on the project without TIF revenues.
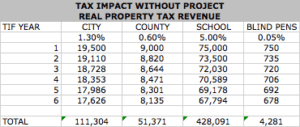
No Project – Real Property Tax Revenues
This sheet considers real property taxes in the event the project does not happen. The State is absent from this calculation as it has no real property levy. Based on the assumptions discussed above, it is assumed that absent redevelopment, the property’s FMV will decrease annually. The revenue per year per district is simply the initial AV times the district levy rate (Year 1 for the City: $1,500,000 x 1.3% = $19,500).
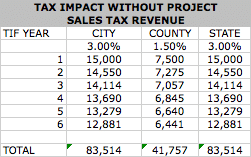
No Project – Sales Tax Revenues
Similarly, the sales tax revenues projected to the three districts with the authority to tax sales (City, County and State) decrease over the six year period as retail sales decrease in the declining property. Revenue per year per district is projected sales multiplied by district levy rate (Year 1 for the City: $500,000 x 3% = $15,000).
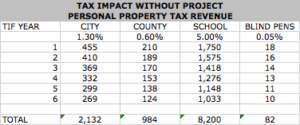
No Project – Personal Property Tax Revenues
While personal property is not captured by TIF in this example, it is impacted by the project, and thus included in the tax impact analysis. Revenue per year per district equals the personal property AV (decreased annually by 10%) multiplied by the district levy rate (in Year 1 for City, $35,000 x 1.3% = $455).
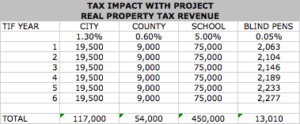
Project With TIF – Real Property Tax Revenues – Real Property Tax Revenues
The “Project with TIF” pages reflect only those tax revenues received by the districts under TIF, and thus do not include any revenues redirected by TIF. Accordingly, in the case of real property, the above table shows that the City, County and School District receive tax revenues equal to the initial AV multiplied by their respective levies. The AV is held static over the term of the TIF. All revenues generated from the increase in real property value over the initial AV is redirected to the project.
Note that the Blind Pension District revenues increase over the period. This is because this district’s levy, in this example, is not subject to TIF capture. Thus, its revenue is equal to the actual real property AV, growing each year, times its levy rate.
Project With TIF – Sales Tax Revenues
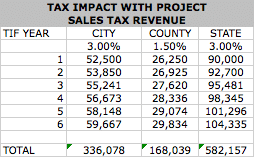
In this example, 50% of the incremental increase in sales taxes is redirected to TIF. Accordingly, the two districts subject to TIF capture, the City and County, receive 100% of their levy against the initial sales, plus 50% of the increase from this initial amount. The calculation in Year 1 for the City is (initial sales x City tax rate) + (sales increment x City tax rate x 50%) = ($500,000 x 3%) + ($3,000,000 x 3% x 50%) = $52,500.
Note that the State, because its levy is not subject to TIF, receives 100% of its levy against 100% of the projected sales. In Year 1, the State sales tax revenue equals $3,000,000 x 3% = $90,000.
Project With TIF – Personal Property Tax Revenues
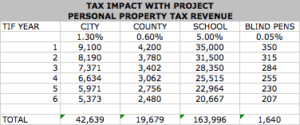
The calculation for personal property tax revenue with TIF is the same as without TIF. In either case, personal property tax revenue is not captured by TIF. However, because the redevelopment assumes that it will include an increased amount of personal property, the related tax revenues to the districts have increased in the With Project calculation.
Tax Impact Analysis – Totals
Totaling the above tables by district and tax type, this table details the increase in tax revenues to the affected districts projected to occur as a result of the project with the use of TIF.
“But For” Feasibility Analysis
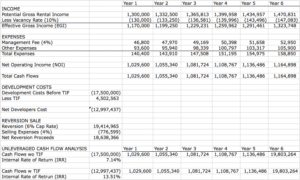
A common method to determine whether the use of TIF is necessary for a project’s financial feasibility is through an analysis of internal rates of return (IRR) with and without the use of TIF. Above is a simplified pro forma and unleveraged IRR calculation using the TIF revenues projected above.
The reasonableness of the proforma assumptions is a large part of examining the reasonableness of this analysis. Was the cap rate of the proposed purchase reasonable (10%)? What about the projected cap rate for the reversion calculation (6%)? Rent, vacancy and rent escalation rates? Operating costs? Whether the “Without TIF” IRR is insufficient to incent a private developer to make the investment given the risk of redevelopment (7.14%)? Is the “With TIF” sufficient to incent the investment (13.51%)?
A common method to answer these assumption questions is to look for guidance from third party consultants engaged by the city, the developer, or both. Additionally, for assumptions relating to the valuation of the property for tax purposes, many will look to the local assessment department.
The above analysis begins with a calculation of net operating income (NOI) over the term of the TIF. In order to calculate the IRR, it sets the developer’s initial outlay ($17,500,000) and the projected TIF revenue ($4,502,563) available to offset the developer’s cost. The analysis projects that the gross reversion proceeds ($19,414,965 = Year 6 NOI $1,164,898 / cap rate 6%), less a selling expense of 4%, results in net reversion proceeds of $18,638,366.
The “With” and “Without” TIF IRR calculations are identical except for the initial developer expense. Without TIF utilizes the full project cost ($10,000,000 purchase price + redevelopment costs $7,500,000), and for With TIF, this amount is reduced by the NPV of TIF revenues ($4,502,563). The resulting IRRs are then compared against industry benchmarks and comparable projects to determine (1) if the developer would pursue the project without TIF (is 7.14% worth the risk?), and (2) if the amount of TIF revenue being redirected to the developer is too great (e.g., if 13.51% is unreasonably high in this market, then TIF revenues should be limited).
Consideration as to whether the IRRs do or do not reflect acceptable levels of return to the developer may consider factors like the nature of the project (e.g., including the life cycle of the property, local market conditions such as new development, major employers and their plan, and demographics), the overall risk associated with the property, inflation expectations, and other factors.
A Common Misconception Relating to TIF Analyses
A common challenge to TIF is that the taxing districts will lose tax revenues. The misconception is that if there was no redirection of taxes, the revenues to the districts would be greater because property values and sales would increase. The problem, however, is in the premise that there is the potential for the project occurring without the use of TIF. As discussed above, TIF is generally not available unless the developer can establish that the project is not feasible, and would not happen in the absence of TIF assistance.
Taxing districts can, nonetheless, challenge this assertion through a critique of the “but for” analyses provided (e.g., the IRR analysis above). Additionally, parties can consider how long the property has been on the market, and surrounding properties, to weigh the likelihood of its future development without TIF.
The district’s concerns should also take into account how the TIF is calculated to determine if a reduction in non-captured tax revenue is projected to occur. This of course varies by state, but in the example above, because the districts will continue to receive taxes based on the existing assessed value of the real property during the term of the TIF, and because the projections assume that the property, if not redeveloped, will continue to decrease in value, the taxing districts will actually receive greater real property tax revenue with TIF. Similarly, those taxing districts with the right to tax sales, will receive an increase in revenue owing to the increase in taxable sales if the project occurs, even though 50% of the sales tax increment will be redirected to the project.
Can the Analyses be Manipulated?
This article raises the question, “can developers or cities manipulate the analyses to reach the conclusion they desire?” While it is possible to change the method of each analysis (e.g., change the holding period in the Feasibility Analysis to return different IRRs), because many local governments tend to require similar formats for the analyses (e.g., in Kansas City, most TIF applications provide a Feasibility Analysis covering a 10-year period), such manipulation is less common.
However, results for each analysis can be changed fairly significantly by changes to the assumptions. Attached are the Excel sheets used for this article. Make a change to any of the assumptions and see what happens to the results.
Download TIF Excel Analysis
Fill out the quick form below and we'll email you the Tax Increment Financing (TIF) Analysis Excel worksheet used in this article.
For example, if the post-redevelopment FMV is changed from $13,750,000 to $18,000,000, the available TIF revenue increases from $5,261,185 to $7,171,489, and the “With TIF” IRR rises from 13.51% to 16.58%. Or, if the cap rate for reversion calculation is changed from 6% to 8%, the “With TIF” IRR drops from 13.51% to 9.37%. And these are only two of many of assumptions (e.g., redevelopment costs, calculation of real and personal property FMV, real and personal property and sales inflation and deflation rates, projected sales, NPV rate, projected project income (and all the assumptions within projected income and expenses like rent rate, vacancy rate, CAM charges, insurance costs, management fees, etc.), selling expenses, cap rates, etc.
Accordingly, any party interested in understanding or challenging a TIF analysis may want to focus their attention on the reasonableness of assumptions. For this very reason, of course, developers and cities will look to third-party consultants to provide supportable assumptions.
Conclusion
We’ve discussed common projections and analyses used to determine whether tax increment financing is appropriate, as well as underlying assumptions and how to determine if they’re reasonable. Given that TIF law varies by state, it’s best to consult with an experienced public incentives attorney if you are dealing with TIF. Have you ever prepared, reviewed or challenged any of these analyses? Let us know in the comments below!

