The breakeven occupancy ratio is one of the less frequently discussed ratios in commercial real estate, yet it’s also one of the most practical and useful ratios to know. It’s also especially important to lenders when underwriting commercial real estate loans. By calculating the percentage of a property that needs to be leased to cover all operating expenses and debt service, this ratio provides a straightforward way to assess financial risk and operational stability. In this article, we’ll discuss how the breakeven occupancy ratio works, why it’s important, and how it’s applied in a real-world scenario.
What is the Breakeven Occupancy Ratio?
The breakeven occupancy ratio is a simple formula used to calculate the minimum occupancy required for a property to break even. It is calculated as:

The breakeven occupancy ratio is calculated by dividing the sum of all operating expenses and debt service by the total potential rental income. Potential rental income is the amount of base rent the property could generate if it were 100% occupied. This metric tells you the percentage of a property that must be leased to cover operating expenses and debt service.
In practice, you might see variations on this calculation which could include how to treat ancillary income, reserves for replacement, expense recoveries, etc. The important thing is to clarify what’s included in the calculation and then stay consistent when looking at trends or making comparisons.
Breakeven Occupancy Example
Consider a proforma with these year 1 figures:
- Total Operating Expenses: 670,580
- Debt Service: 1,053,154
- Potential Rental Income: 2,184,000
We can take all of these numbers and plug them into our breakeven occupancy formula:
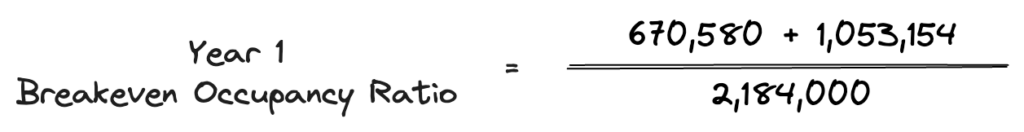
First, combine operating expenses and debt service:
Next, divide by potential rental income:
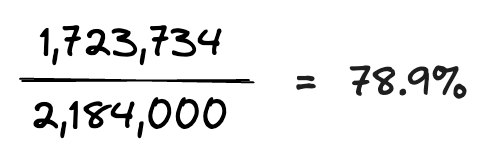
In year 1, the operating expenses totaled 670,580, while debt service amounted to 1,053,154. Combined, this was 1,723,734. The potential rental income for the property was 2,184,000. Dividing 1,723,734 by 2,184,000 results in a breakeven occupancy ratio of 78.9%.
This breakeven occupancy ratio means the property must be 79% occupied to meet all operating expense and debt service obligations. In other words, the vacancy rate on this property can go up to about 21%, and we’ll still be able to continue paying all bills and loan payments on time.
Breakeven Occupancy Trends
Is this breakeven occupancy ratio good or bad? As always, it depends on the context. For example, if a lender was underwriting this property and calculated a 78.9% breakeven occupancy, it would then be compared to the market vacancy rates for this property type. If the vacancy rate for multifamily properties in this particular sub-market was 10%, then a breakeven occupancy ratio of 79% (a 21% vacancy rate) would provide a more than adequate cushion to protect against a higher than average vacancy rate.
On the other hand, if the market vacancy rate was closer to 15%, then the lender may want to look further into how the breakeven occupancy ratio changes over the holding period:
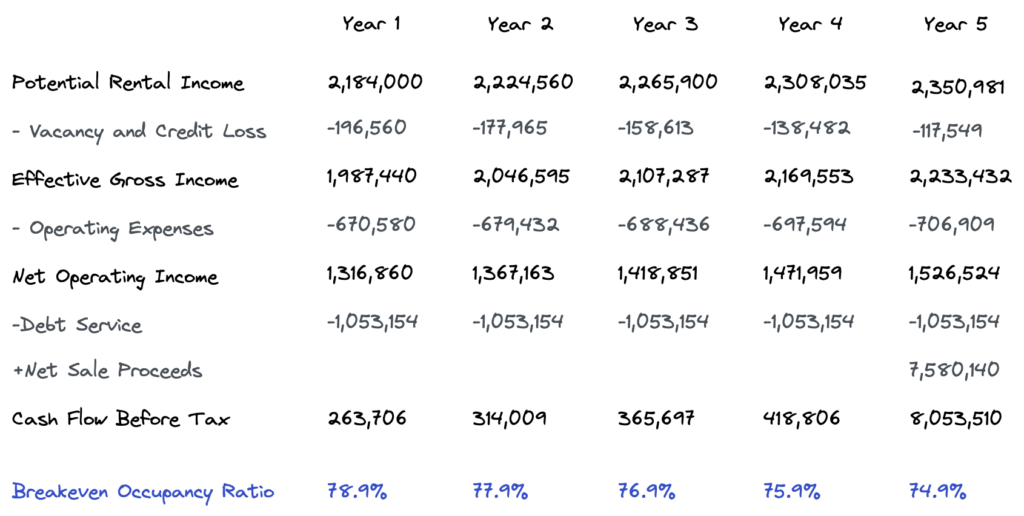
As shown above, the breakeven occupancy ratio steadily declines from about 79% in year 1 down to 75% in year 5. Perhaps this trend analysis could demonstrate lower risk over time, which might provide additional comfort to the lender.
Breakeven Occupancy Per Unit
Another way to think about the breakeven occupancy ratio is on a per unit basis. Our analysis so far simply computes a percentage of total potential rental income, but what does this mean in terms of actual units?
Suppose you have a proforma with a total of 140 units that generate an average of $1,300 in rent per month. Recall that our year 1 breakeven occupancy was 79%. That means in year 1 we can have up to 29 units vacant in any given month, and we’ll still breakeven.
140 units x 79% = 110.46 = 111 units
In other words, we need 111 units occupied to breakeven. Note that we rounded this up since we can’t have a partial unit rented. At $1300/month each, that is 1,731,600 in base rental income, which is enough to cover our combined operating expenses and debt service of 1,723,734.
This provides us with a more tangible metric to track over time and allows us to raise a red flag once our vacant units cross a certain threshold.
Conclusion
The breakeven occupancy ratio is easy to calculate and provides a lot of insight into a deal. Knowing what your thresholds are in terms of actual units can also give you a tangible metric to track over time. Although it’s not the most popular commercial real estate ratio, breakeven occupancy should definitely be in your toolbox.