Understanding supply and demand conditions is an important step in the commercial real estate market analysis process. Yet, analyzing supply and demand for commercial real estate can be challenging because it involves sorting through large amounts of data from different sources. In this article we’ll walk through an example supply and demand analysis for retail buildings in Orlando, FL.
Population Trends and Retail Building Demand
Recent data from the U.S. Census Bureau and the Orlando Economic Development Commission lists the total population of the Orlando metro area at 2,387,138 (2016). Between 2015 and 2016, the population of the Orlando metro area grew by 2.6%. That made Orlando the fastest growing region in the United States. The Orlando Economic Development Commission estimates that population growth in the region since 2000 equates to a gain of 138 people per day. Population growth is mostly fueled by domestic migration. Americans moving to Orlando for retirement in warmer weather or for new career opportunities account for about 40% of the population increase. International migration (mainly from Central and South America) accounts for 34% of the increase in population. People have been moving to the Orlando area due to the region’s comparative advantages (climate, entertainment and lifestyle, and economic growth). Without these advantages, Orlando would not be one of the fastest growing regions of the country.
In addition to the effect of population growth on the retail market, Orlando has an enormous influx of tourists into the area every year. Those tourists spend money that helps to boost retail sales in the area. Visit Orlando, the official tourism association for Orlando, reported that a record 68 million people visited the Orlando area in 2017, which was an increase from 66 million visitors in 2016. Dividing those numbers by 365 days in a year, retailers in Orlando benefit from an average of almost 200,000 additional people per day visiting the city.
Economic Trends and Retail Building Demand
Employment data from the Bureau of Labor Statistics confirms that economic growth is driving the population growth in the Orlando metro area. In fact, job growth from 2015-2016 in Orlando was over twice the national average. A strong economy and growth in the number of jobs indicates that the population should continue to grow over the next few years unless there is a major shift to the national economy or a natural disaster.
| Area | Industry | Annual Average Employment | Change Employment 2015-2016 | Growth Rate | |
| 2016 | U.S. TOTAL | Total, all industries | 141,870,066 | 2,378,367 | 1.71% |
| Orlando-Kissimmee-Sanford, FL MSA | Total, all industries | 1,157,536 | 46,844 | 4.22% | |
| 2015 | U.S. TOTAL | Total, all industries | 139,491,699 | ||
| Orlando-Kissimmee-Sanford, FL MSA | Total, all industries | 1,110,692 |
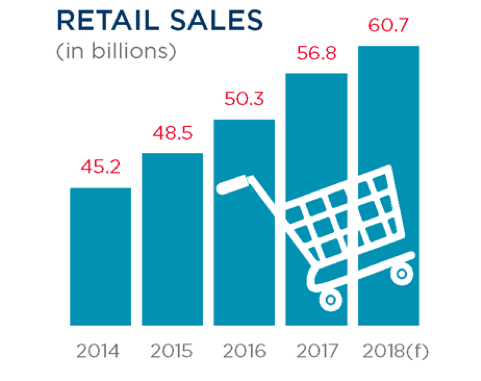
Another important economic indicator of demand for retail property is the growth in retail sales dollars for the region. A study by Cushman and Wakefield reported that the Orlando metropolitan area had retail sales totaling $56.8 billion in 2017. The projection for retail sales in 2018 is $60.7 billion, which is a growth rate of almost 7%.

Retail Building Supply and Demand
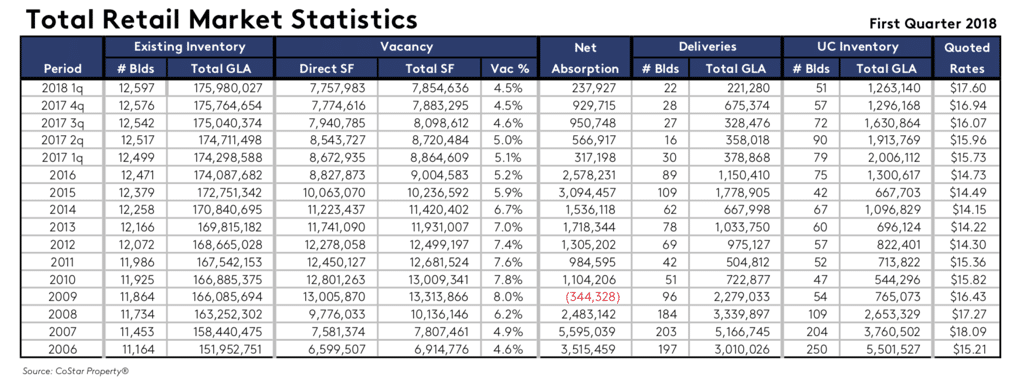
Data supplied by CoStar Property reported a total of 12,597 retail buildings with 175,980,027 sqft of leasable space at the beginning of 2018. The average vacancy rate was 4.5%. The combination of increasing quoted rental rates and decreasing vacancy rates is an indication that demand is currently growing faster than supply.

Given the current supply and vacancy rates, demand for retail property in Orlando can be estimated as 168,060,926 sqft. With population growing at over 4% annually and retail sales growing at around 7%, a conservative estimate for future growth in retail markets might be around 5% annually. If supply were held constant, demand would exceed supply by 2019.
| 2018 | 2019 | 2020 | 2021 | 2022 | |
| Available | 175,980,027 | 175,980,027 | 175,980,027 | 175,980,027 | 175,980,027 |
| Vacant | 4.5% | -0.3% | -5.3% | -10.6% | -16.1% |
| Demand | 168,060,926 | 176,463,972 | 185,287,171 | 194,551,529 | 204,279,106 |
In fact, if demand increased by 5% annually over the next five year, the Orlando metro area would require at least 8 million square feet of new retail space each year. These estimates are much higher than current plans for new retail construction. Therefore, it is reasonable to assume that rents will continue to increase and that retailers may lease smaller spaces.
| 2018 | 2019 | 2020 | 2021 | 2022 | |
| Available | 175,980,027 | 183,980,027 | 191,980,027 | 199,980,027 | 207,980,027 |
| Vacant | 4.5% | 4.1% | 3.5% | 2.7% | 1.8% |
| Demand | 168,060,926 | 176,463,972 | 185,287,171 | 194,551,529 | 204,279,106 |
Another way to measure market demand for retail space is to employ a market average ratio of annual retail sales income per square foot of leased area. Using the previous calculation for actual leased space of 168,060,926 square feet and expected retail sales of $60.7 billion, Orlando should have average retail sales of $361 per square foot of leased area. The U.S. national average is $325 per square foot, and Orlando exceeds the national average. Keeping the sales per square foot of leased space constant, the Orlando metro area would need to add an additional 12 million square feet of retail space per year to keep pace with the growth in sales.
| 2018 | 2019 | 2020 | 2021 | 2022 | |
| Retail Sales | 60,700,000,000 | 64,949,000,000 | 69,495,430,000 | 74,360,110,100 | 79,565,317,807 |
| Demand | 168,060,926 | 179,914,127 | 192,508,116 | 205,983,684 | 220,402,542 |
| Sales/SQFT | 361 | 361 | 361 | 361 | 361 |
| Available | 175,980,027 | 187,980,027 | 199,980,027 | 211,980,027 | 223,980,027 |
Given recent trends in favor of online shopping rather than traditional retail shopping, however, market trends indicate that far less retail space needs to be added. Traditional shopping centers in particular have struggled to keep tenants as consumer shopping preferences have moved away from this retail icon throughout the past decade. Online retailers continue to gain market share over brick and mortar retailers, and traditional retailers are exploring new business models with options such as same-day delivery. Market dynamics such as these may explain why the supply suggested by the forecast models over-estimates the demand for retail real estate as reported by CoStar. In fact, the combination of growth in the population and tourists visiting Orlando may be keeping retail property development positive while other markets experience declines.
Conclusion
This example illustrates how to convert data about population growth, retail sales, and real estate supply into a forecast of supply and demand conditions over the next five years. One of the important lessons to take away from this analysis, however, is the importance of changing market trends and behaviors. So, even though the forecasted numbers indicate the Orlando market might need an average of 10 million sqft of retail space added annually to keep up with current demand trends, far less is likely to actually be required. This deviation from forecasting models is part of the reason why market analysis is so important. Analysts need to take a holistic approach to forecasting and valuation so that they can evaluate the impact of each unique market component.
