The discount rate is one of the most frequently confused components of discounted cash flow analysis. What exactly is the discount rate, and how does it work? What discount rate should I use in my analysis? These are all important questions to ask, and this article will explain the answers in detail. Read on for a deep dive into the concept of the discount rate as it relates to valuation and discounted cash flow analysis.
Discount Rate Definition
What is the discount rate? The discount rate is the interest rate used to find the present value of future cash flows. Consider the Net Present Value (NPV) formula, which sums the present values for a series of cash flows:
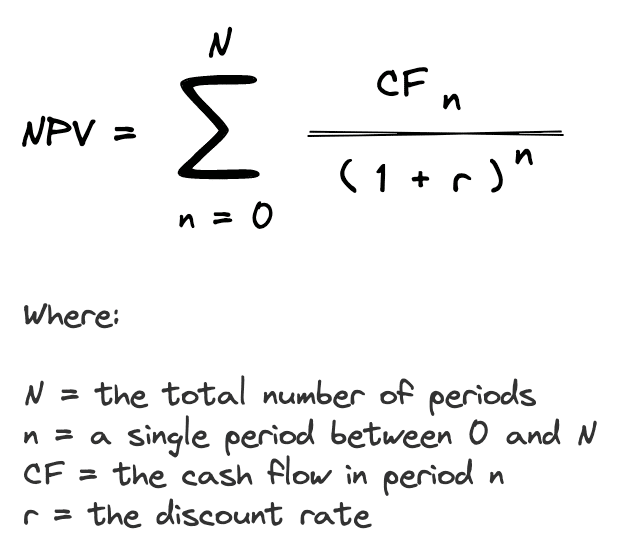
In the NPV formula, all future cash flows (CF) over some holding period (N), are discounted back to the present using a rate of return (r). This rate of return (r) in the above formula is the interest rate, which is commonly called the discount rate.
Discount Rate Intuition
Most people immediately understand the concept of compound growth. If you invest $100,000 today and earn 10% annually, then your initial investment will grow to about $161,000 in 5 years. This happens because your initial investment is put to work and earns a dividend and/or appreciates in value over time.
When solving for the future value of money set aside today, we compound our investment at a particular rate of interest. When solving for the present value of future cash flows, the problem is one of discounting, rather than growing, and the required return acts as the discount rate. In other words, discounting is merely the inverse of growing.
Discount Rate Sensitivity
When it comes to discounted cash flow analysis, your choice of discount rate can dramatically change your valuation. Consider the following analysis showing the sensitivity of net present value to changes in the discount rate:
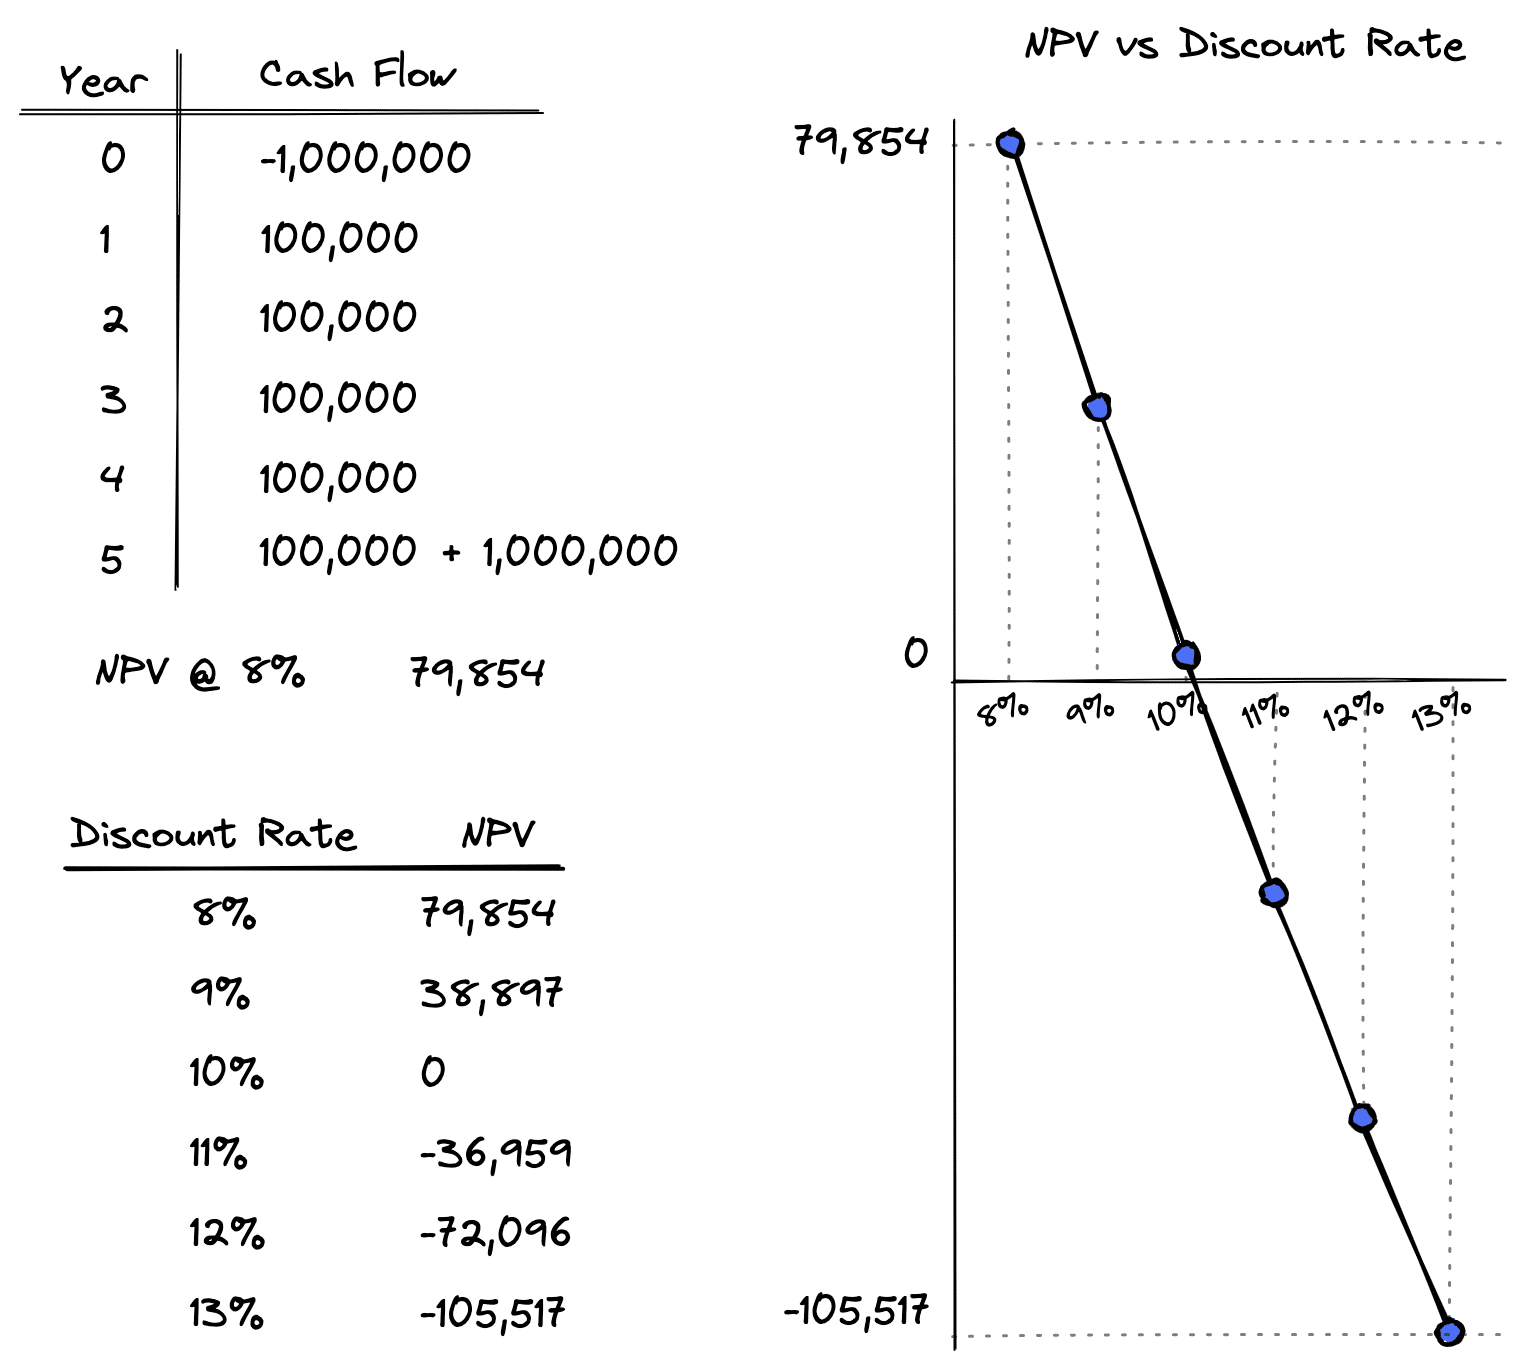
As shown in the analysis above, the net present value for the given cash flows using a discount rate of 10% is equal to $0. This means that with an initial investment of exactly $1,000,000, this series of cash flows will yield exactly 10%. As the required discount rates moves higher than 10%, the investment becomes less valuable.
This happens because the higher the discount rate, the lower the initial investment needs to be to achieve the target yield. As illustrated above, the selection of the discount rate can have a big impact on the discounted cash flow valuation. For more background on the Net Present Value (NPV), check out the Intuition Behind IRR and NPV and NPV vs IRR.
Selecting a Discount Rate For an Individual Investor
Since the discount rate matters so much, how do you go about selecting the appropriate discount rate for an individual investor? Non-corporate or individual investors normally consider their opportunity cost of capital when determining the appropriate discount rate.
What is the opportunity cost of capital? Simply put, it’s the rate of return the investor could earn in the marketplace on an investment of comparable size and risk. It’s the opportunity the investor would be giving up if he/she invested in the property or investment in question, thus the term “opportunity cost.”
For example, if you have $1,000,000 to invest, what are all of your available investment alternatives with similar risk profiles? Whatever the yield is on all of these alternative opportunities is the appropriate discount rate to use. Another way to think about this is that for an individual investor, the discount rate is simply the individual investor’s required rate of return.
Selecting a Discount Rate For a Corporate Investor
Selecting the appropriate discount rate for a corporate investor is a bit more difficult. Corporations often use the Weighted Average Cost of Capital (WACC) when selecting a discount rate for financial decisions. Broadly speaking, a company’s assets are financed by either debt or equity. A corporation can also use retained earnings, which are the after-tax earnings not distributed to shareholders in the form of a dividend.
The WAAC is simply the weighted average of each of these sources of financing. This is also commonly called the “hurdle rate” because for an enterprise to be profitable it has to earn a return greater than the cost of capital. In other words, it must cross over the “hurdle” to be profitable.
The debt portion of the capital structure is typically in the form of short-term unsecured notes provided by commercial banks, and long-term debt is usually provided by bond investors. The equity portion of the capital structure is normally in the form of preferred stock and common stock. The interest paid on short and long-term debt is deductible for tax purposes, whereas the dividends paid to shareholders is not. Any after tax earning a corporation generates that is not paid out to investors is kept as retained earnings.
Consider the following example:
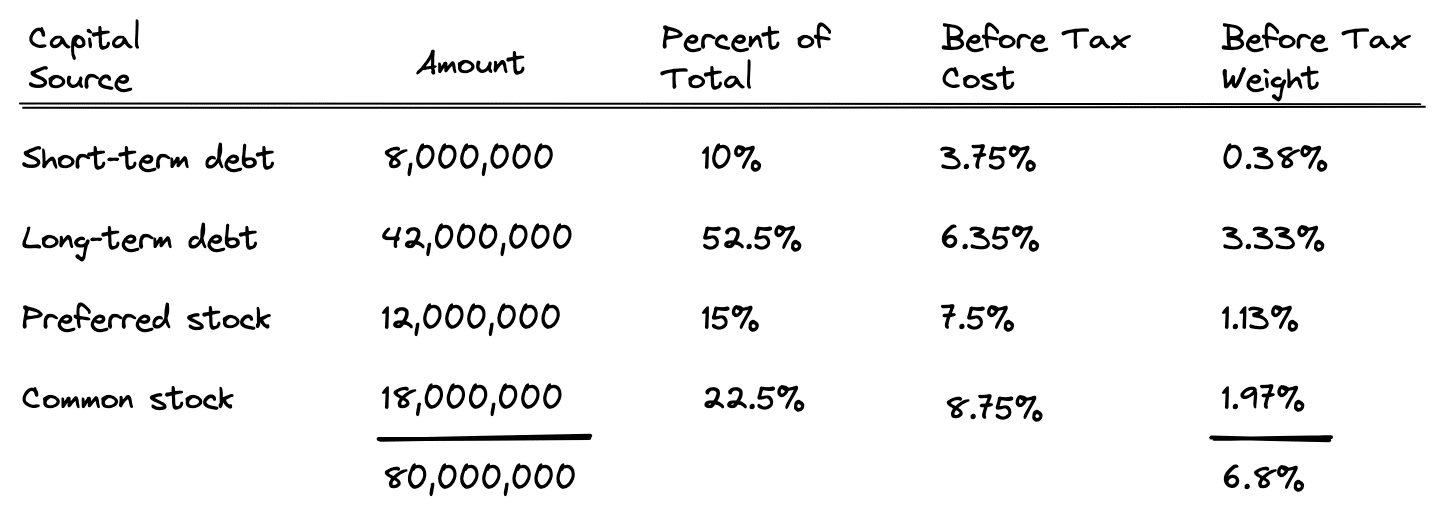
To find the before tax weight of each source of capital, you can simply multiply the percent of total figure for each source by the before tax cost of each source. For example, short-term debt comprises 10% of the total capital and has a cost of 3.75%. Multiplying these two figures together, results in a before tax weight of 0.38%.
Completing this for each source of capital results in a total weighted average cost of capital of 6.80%. This is the appropriate discount rate to use for this corporate investor. Any investment that the company makes must at least achieve a 6.80% return to satisfy debt and equity investors. Any return greater than 6.80% will create additional value for the shareholders.
Discount Rates and Historical Asset Class Returns
Another way to think about the discount rate is to look at historical asset returns for the investment in question. Consider the following chart showing historical asset returns between 1970-2010:
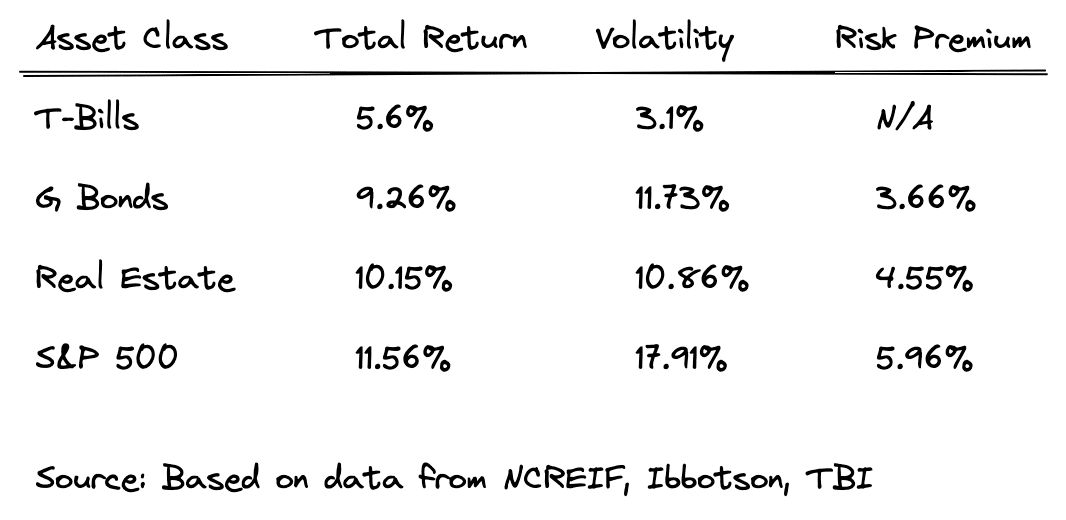
The above chart shows historical asset class returns for Treasury Bills, long-term U.S. government bonds, institutional-quality commercial real estate as measured by NCREIF, and stocks as measured by the S&P 500. Additionally, the chart breaks out the volatility and calculates the risk premium of each asset class over and above Treasury Bills, which are traditionally considered “risk-free” in finance.
As shown above, the risk premium on institutional quality commercial properties represented by the NCREIF index averaged 4.55 percent (or 455 basis points). The risk premium on long-term bonds was 366 basis points, while the risk premium on stocks was the highest, at 596 basis points.
In finance, the total rate of return consists of two parts: the risk-free rate plus some risk premium (r + RP). For short-term investments, the traditional choice for the risk-free rate is the current T-Bill. However, because commercial real estate is a longer-term investment with an average holding period of 10 years, the appropriate risk-free rate is the average T-Bill rate expected over the investment horizon.
For a 10-year holding period, the 10-Year T-Bond would be an appropriate choice. As an aside, sometimes even the 10-Year T-Bond yield is adjusted downward to account for the “yield curve effect”, which is the additional risk premium already built into the T-Bond over and above the shorter term T-Bill yields.
If these historical risk premiums represent current expectations, then we can use the risk-free rate calculated, and add in the historical risk premium to determine the total expected return. For example, if the risk-free rate was determined to be 3%, then adding in the above 4.55% risk premium would suggest a total return expectation of 7.55% for institutional-quality commercial real estate.
Discount Rates and Expected Returns
Because what happened in the past is not a guarantee of what will happen in the future, it’s often useful to look at expected returns going forward. In addition to the historical returns discussed above, another approach to estimating the current expected total return is to simply ask investors what they expect.
Of course, this is always easier said than done. Larger commercial brokerage firms collect data on these return expectations regularly, as do some appraisers and lenders. Additionally, there are several commercial real estate research firms that survey investor preferences regularly. One of the most popular survey’s is the Korpacz survey. While expensive, this report is regularly used by institutional investors. Some of the larger brokerages like CBRE also issue similar discount rate surveys for free.
Introducing CRE Investment Analysis Fundamentals
A complete online course that teaches you the entire commercial real estate investment analysis process
A big picture overview of the commercial real estate investment analysis process
A step-by-step walkthrough of the real estate proforma
How to calculate and interpret simple measures of investment performance
A complete time value of money crash course
A walkthrough of the intuition and calculations behind IRR and NPV
How commercial real estate loans work, including a lender comparison spreadsheet
Office building case study with 5-year proforma, ratios, and discounted cash flow analysis
Fully unlocked Excel models included
60-day money-back guarantee
Relationship Between the Cap Rate and the Discount Rate
Because cap rate data is easier to obtain than investor IRR expectations, it’s also worth mentioning the relationship between the cap rate and the discount rate. You may recall the Gordon Model from our article on the cap rate:

This formula solves for value, given the stabilized cash flow, the discount rate, and a constant growth rate. From the definition of the cap rate, we also know that the value can be found by dividing NOI by the cap rate.
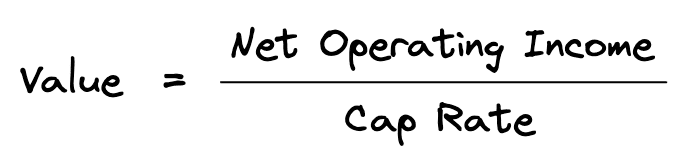
Notice that cash flow is in the numerator of both of the equations above. In the second formula, we are just using NOI for cash flow. This means that both formulas are the same and therefore the cap rate can be broken down into two components, the discount rate and the growth rate. That is, the cap rate is simply the discount rate minus the growth rate.

Using some basic algebra, we can of course re-arrange this handy equation and solve for the discount rate. This tells us that the discount rate is equal to the cap rate plus the growth rate.

Most medium and large brokerage firms issue quarterly market reports that include cap rates on recent transactions. Reporting cap rate data is much more common than reporting IRR expectations. This means you can estimate the appropriate discount rate based on current cap rates in your market. Simply take the relevant cap rate and add in a reasonable growth estimate, and you’ll have an approximate discount rate to use in your discounted cash flow analysis.
One limitation to this approach is that cap rate data is based on proforma net operating income, not cash flow before tax. To account for this difference, it’s sometimes common to simply adjust the cap rate downward by 100-200 basis points.
The Discount Rate and Discounted Cash Flow Analysis
The discount rate is a crucial component of a discounted cash flow valuation. The discount rate can have a big impact on your valuation, and there are many ways to think about the selection of discount rates. Hopefully, this article has clarified and improved your thinking about the discount rate. If you need help building a commercial real estate proforma and completing a discounted cash flow analysis, you might consider giving our commercial real estate analysis software a spin.